
 The DE OFCCP Week in Review (WIR) is a simple, fast and direct summary of relevant happenings in the OFCCP regulatory environment, authored by experts John C. Fox, Candee Chambers and Cynthia L. Hackerott. In today’s edition, they discuss:
- Consultant Provided Insights on Building Foundational Relationships in Native American & Tribal Communities in New DE Talk Podcast
- US BLS JOLTS Report Revealed the U.S. Job Market Shrunk 3.3% Month-Over-Month Continuing a Stairstep 6-Month Decline
- Economy Added 263k Jobs in November; Unemployment Rate Remained at 3.7%
- In Brief
- Looking Ahead: Upcoming Date Reminders
Tuesday, November 29, 2022: Consultant Provided Insights on Building Foundational Relationships in Native American & Tribal Communities in New DE Talk Podcast
Many barriers to employment exist for millions of Americans, and one subset remains vastly underserved – Native American veterans and tribal communities. Tune in as Christopher Key from Hesperus shares more insight into cultural differences, as well as how Hesperus is investing in the next generation of Native American and Alaska Native leadership, and creating pathways to education and employment through training, workforce development, and technology. This new DE Talk Podcast also corresponds with November as Native American Heritage Month. Click here to listen now!
Listen to our DE Talk Podcast via any of the options below and subscribe to receive updates whenever a new podcast is available.
Apple • Spotify • Google • Stitcher • iHeartRadio • Stitcher • TuneIn • Overcast • Pocket Casts• Castro • Castbox • Podchaser • RSS Feed
…or your preferred Podcast provider

Wednesday, November 30, 2022: US BLS JOLTS Report Revealed the U.S. Job Market Shrunk 3.3% Month-Over-Month Continuing a Stairstep 6-Month Decline
In October 2022, the number of nonfarm sector job openings decreased to 10.3 million (minus 353,000), compared to 10.7 million in September, the U.S. Bureau of Labor Statistics (BLS) reported in its Job Openings and Labor Turnover Summary (JOLTS) Report for October 2022. JOLTS reports a month late (i.e., in December) for the month two months prior (i.e., October). NOTE: Most of the big lay-off announcements in the U.S. have come in November leading economists to expect January’s coming JOLTS report (for November 2022) to report a further sharp decline in the size of the U.S. job market. Hires in October 2022 were 6.0 million, down a little from 6.1 million in September. Total separations held steady at 5.7 million.
IMPORTANT: Lies, Damned Lies, and Then There are Statistics: Until the just released JOLTS report for October 2022, the early November 2022 monthly short-term unemployment report of 261,000 new jobs added in October looked pretty good, as we reported here. However when one calculates the “net gain” in monthly jobs (job gains vs job losses) one now sees that the U.S. jobs market shrunk in October (and in many prior months) because job losses exceeded job gains: 261,000 (job gains BLS reported on November 4, 2022 in its Jobs “Economic Situation” Report for October minus 353,000 (job losses) = a net loss of 92,000 jobs in the U.S. marketplace in October 2022).
U.S. Department of Labor Chief Economist Joelle Gamble reported on Twitter that the data for October showed a 3.3 percent decrease in total openings from September. Professional Service sector and manufacturing jobs were the hardest hit in October. The October rate was 1.0 percentage points lower than its peak in March 2022 following a steady 6-month ongoing shrinkage of the labor market, as the following chart she shared illustrates:
Today’s job openings and labor turnover (JOLTS) survey data for October show a 3.3% decrease in total openings from September. In same month, the economy added 261k jobs. Hires and separations levels were mainly unchanged. (1/4) pic.twitter.com/aW5UK61BVb
— Joelle Gamble (@joelle_gamble) November 30, 2022
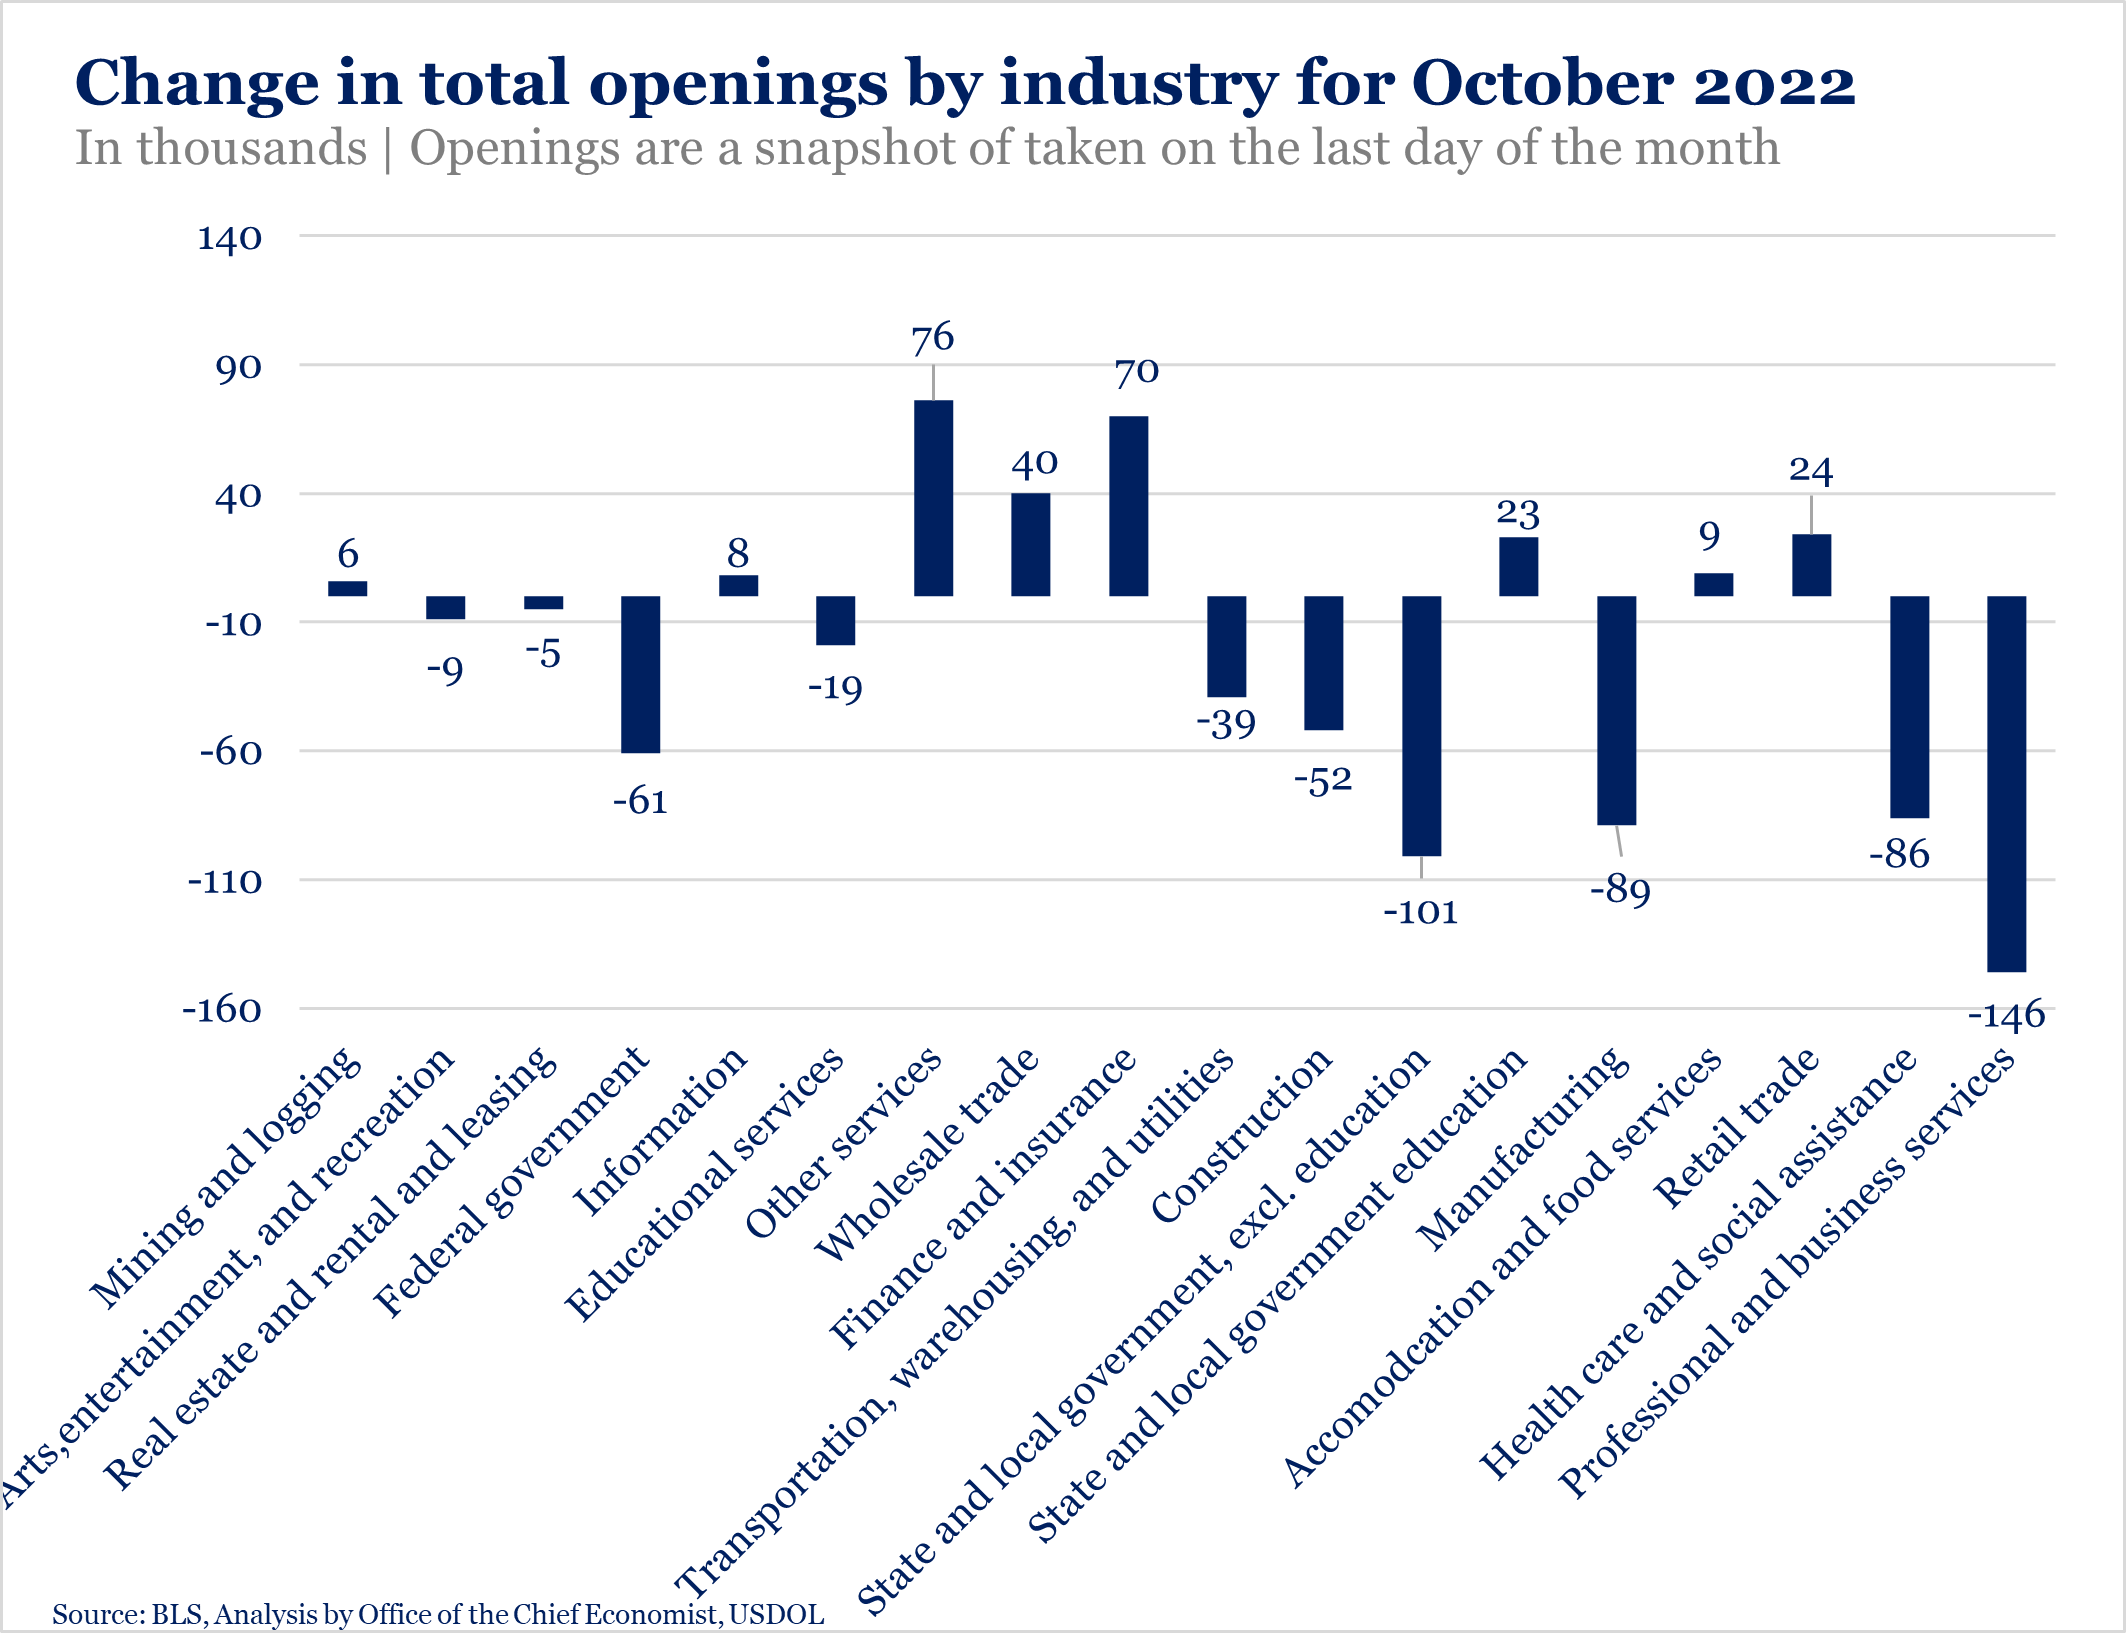
Job Openings Decreased in Government Jobs, Manufacturing; Increased in Finance & Insurance
Job openings decreased in professional and business services (-146,000), state and local government, excluding education (-101,000); nondurable goods manufacturing (-95,000); and federal government (-61,000). However, job openings increased in other services (+76,000) and in finance and insurance (+70,000). Economist Gamble shared the following chart to illustrate those numbers:
Little Change in The Number of Hires and Separations
The number of hires in the U.S. in October was 6.0 million/3.9 percent, down slightly from 6.1 million/ 4.0 percent in September. Hires and separations changed little in all industries.
Total separations remained at 5.7 million and the rate did not change at 3.7 percent of the total workforce. Within separations, the number and rate of voluntary quits did not change much at 4.0 million and 2.6 percent, respectively. In September, the number was 4.1 million and the rate was 2.7 percent.
The number for layoffs and discharges was 1.4 million, up some from September’s 1.3 million. The rate did not change at 0.9 percent.
How “Tight” Is the U.S. Labor Market? (Important for recruiters to know)
Economist Gamble reported that the ratio of unemployed workers to job openings showed a less tight market in October (rising from 0.54 to 0.59). (Economists describe the market as “tight” if jobs are plentiful and available workers are scarce). A 1:1 ratio of unemployed to job openings would show one person unemployed to each available job opening. A rise from .54 (almost two persons unemployed to every job opening) to .59 shows that the market is more ”loose” as the scarcity of workers diminished (slightly easier times for recruiters ahead).
Another way to measure how “tight” the recruitment market is to measure the “quits rate.” The percentage of employees quitting continued its decline in October (thus producing fewer vacancies to fill) as the red line illustrates in the below chart Ms. Gamble attached to her second tweet. (Do not feel like the “Lone Ranger” if you struggle to understand what the units of measurement are in the “Quits rate” graph Ms. Gamble supplied. What is more important, at any rate, is the trend line.)
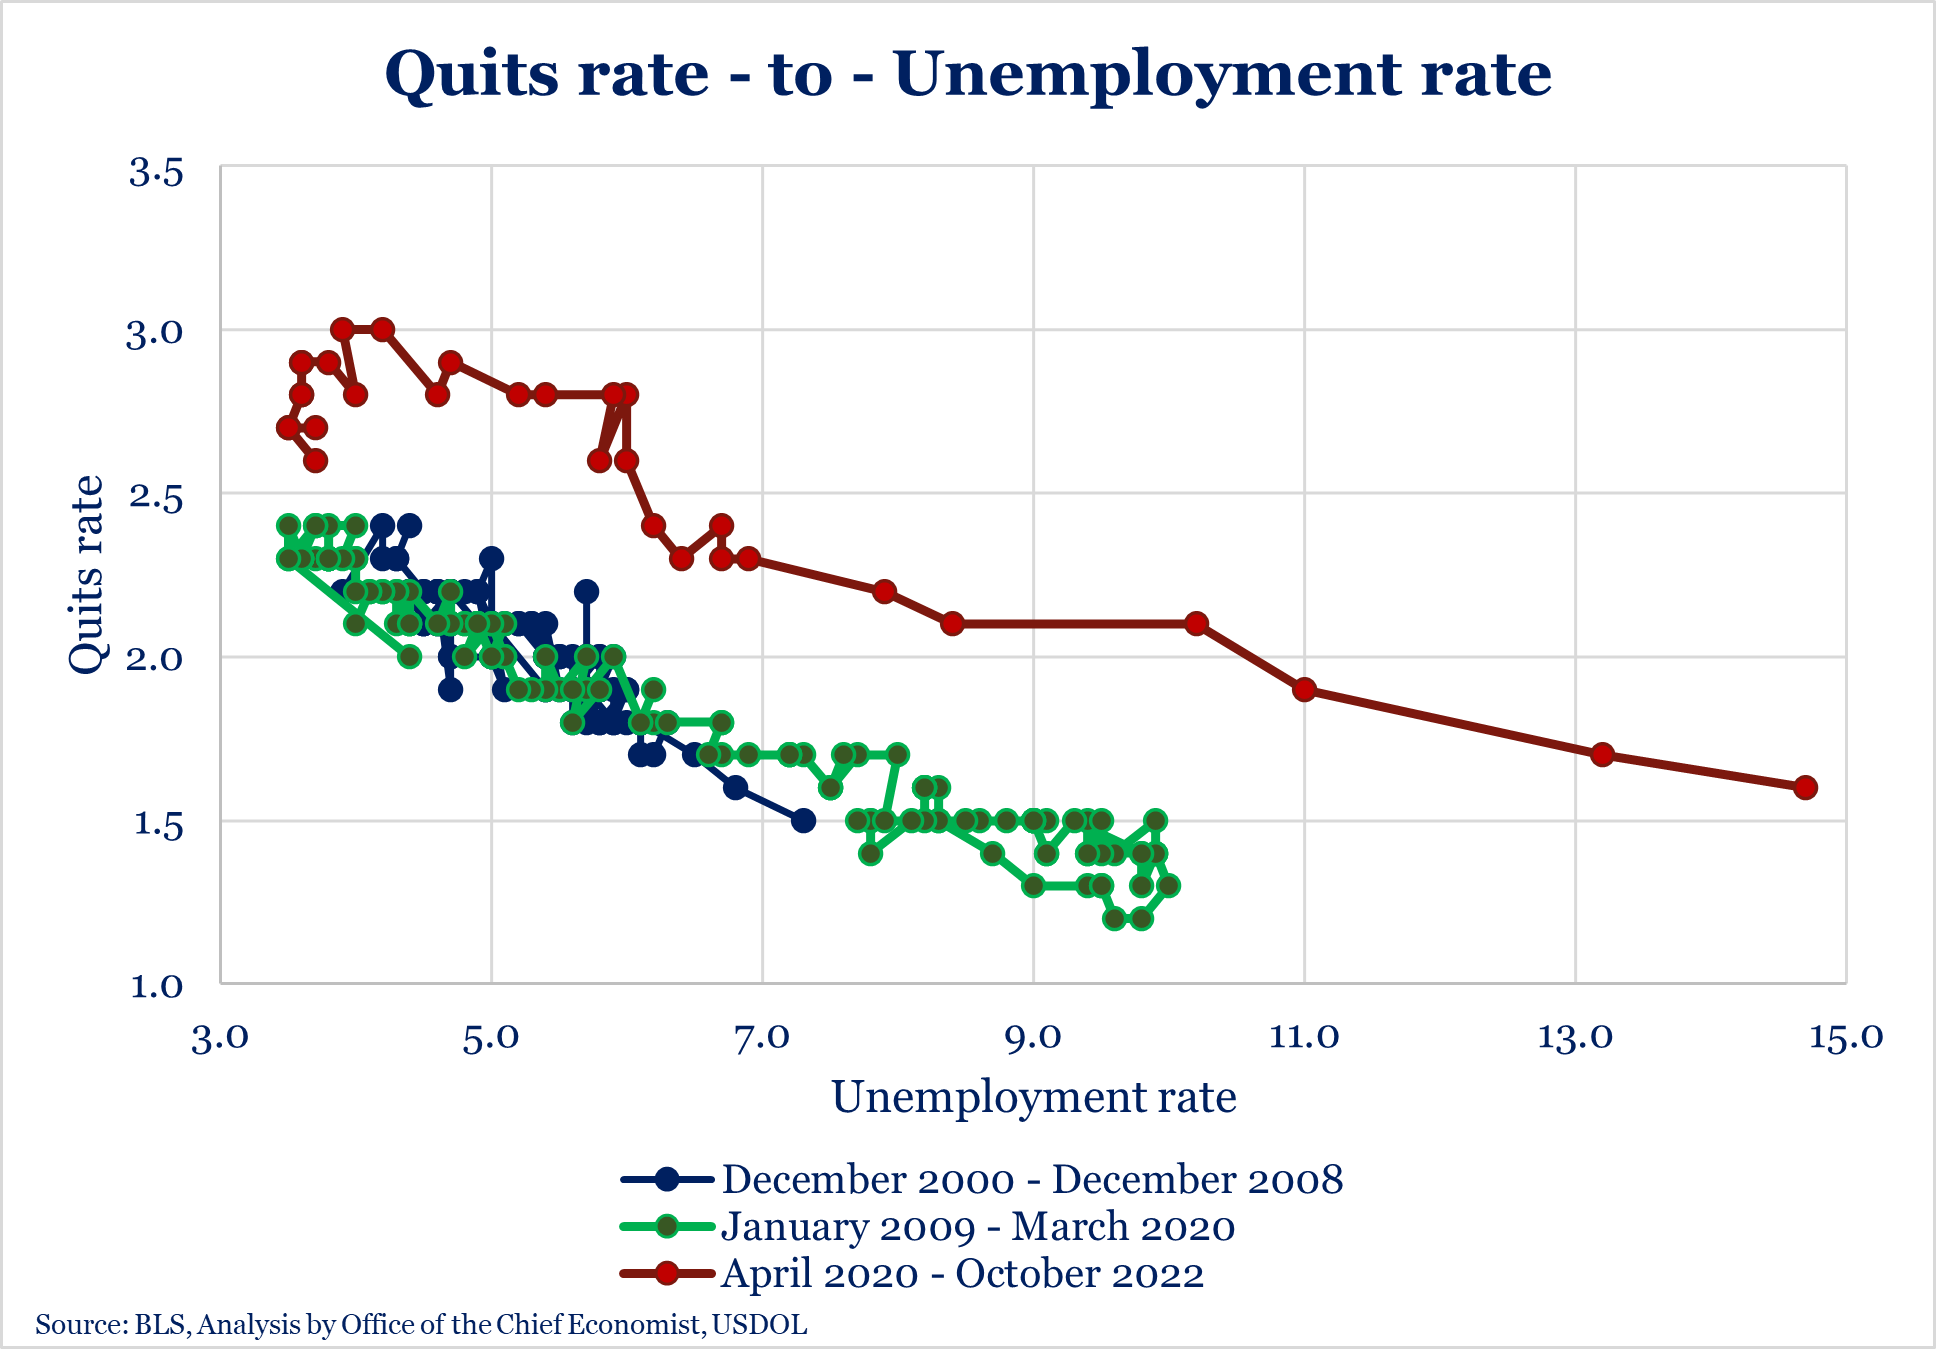
BLS has additional interactive charts here.
The JOLTS Report Is Increasingly Important as the Federal Reserve Now Uses It for Interest Rate Considerations
In the final tweet of her four-part thread, Economist Gable noted a report from Reuters on Tuesday that “Federal Reserve Chair Jerome Powell has made the JOLTS job vacancy estimate a touchstone in how he views the labor market and, as a result, the possible course of interest rates.”
Friday, December 2, 2022: Economy Added 263k Jobs in November; Unemployment Rate Remained at 3.7%
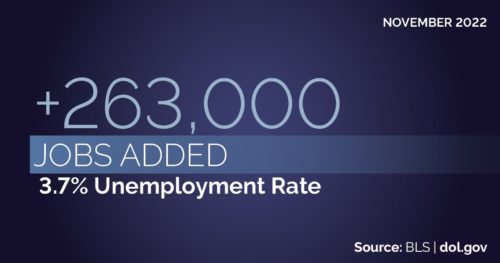 Total nonfarm payroll jobs increased by 263,000 in November, up slightly from the 261,000 increase in October, the U.S. Bureau of Labor Statistics (BLS) reported in its latest monthly jobs report. (We will not know until BLS reports its JOLTS report on January 4, 2023, reporting how many jobs were lost in the U.S. economy in October.) Notable job gains in October occurred in leisure and hospitality, health care, and government, the Bureau said. Employment declined in retail trade, transportation, and warehousing.
The short-term unemployment rate (those unemployed for fewer than 5 weeks) remained at 3.7 percent for the second month in a row. Among the unemployed, the number of permanent job losers rose by 127,000 to 1.4 million up from 1.2 million in October. The number of persons on temporary layoff changed little at 803,000 compared to October’s 847,000.
The labor force participation rate, now at 62.1 percent, decreased a smidge from 62.2 percent in October. This means that fewer Americans available to work were working in October. The employment-population ratio was 59.9 percent – almost unchanged from October’s 60.0 percent. BLS noted that these measures are 1.3 percentage points below their values in February 2020, prior to the coronavirus (COVID-19) pandemic. (This is the “Great Resignation” number: the population has grown, but the job market has not grown as fast as the population…hence fewer available workers “participating” in the labor force).
Long-term Unemployment Numbers Changed Little
The numbers for total unemployment are reported in a chart here. Unemployment (seasonally adjusted) for 5 to 14 weeks was at 28.4 percent in October, down from 29.9 percent. The rate for unemployment of 15 to 26 weeks in October was 13.4 percent, a small decrease from 13.5 percent. The unemployment rate for 27 weeks and over was 20.6 percent, up from 19.5 percent in October. The number of long-term unemployed (those jobless for 27 weeks or more) was 1.2 million in November, unchanged from October. The long-term unemployed accounted for 20.6 percent of all unemployed persons.
Notable Changes Illustrated in Charts
In her Twitter thread on the November Report, U.S. Department of Labor (USDOL) Chief Economist Joelle Gamble pointed out that “[t]here are now over 1 [million] more jobs in the U.S. than in Feb 2020 and private payrolls are 1.5 m higher than in Feb 2020.” She shared the following chart to illustrate this point [although this ignores that during this 33-month period a nominally growing labor market keeping up with the expansion of the population and adding only 140,000 new jobs each month would have added over 4.6 million new jobs (33 months x 140,000):
JOBS REPORT: In November, the economy added 263,000 jobs (272K 3-mo. moving average). There are now over 1 mn more jobs in the U.S. than in Feb 2020 and private payrolls are 1.5 mn higher than in Feb 2020. The unemployment rate was 3.7%, the same as in October. (1/6) pic.twitter.com/DDGvVyIjh0
— Joelle Gamble (@joelle_gamble) December 2, 2022
Highlighting some sector-specific changes, Economist Gamble shared the following chart. She noted that “the social assistance sector fully recovered [to the level of employment at the start of the pre-COVID-19 pandemic but not to what it would have been at the end of the pandemic, but for that pandemic] largely due to increasing payrolls in individual and family services.”
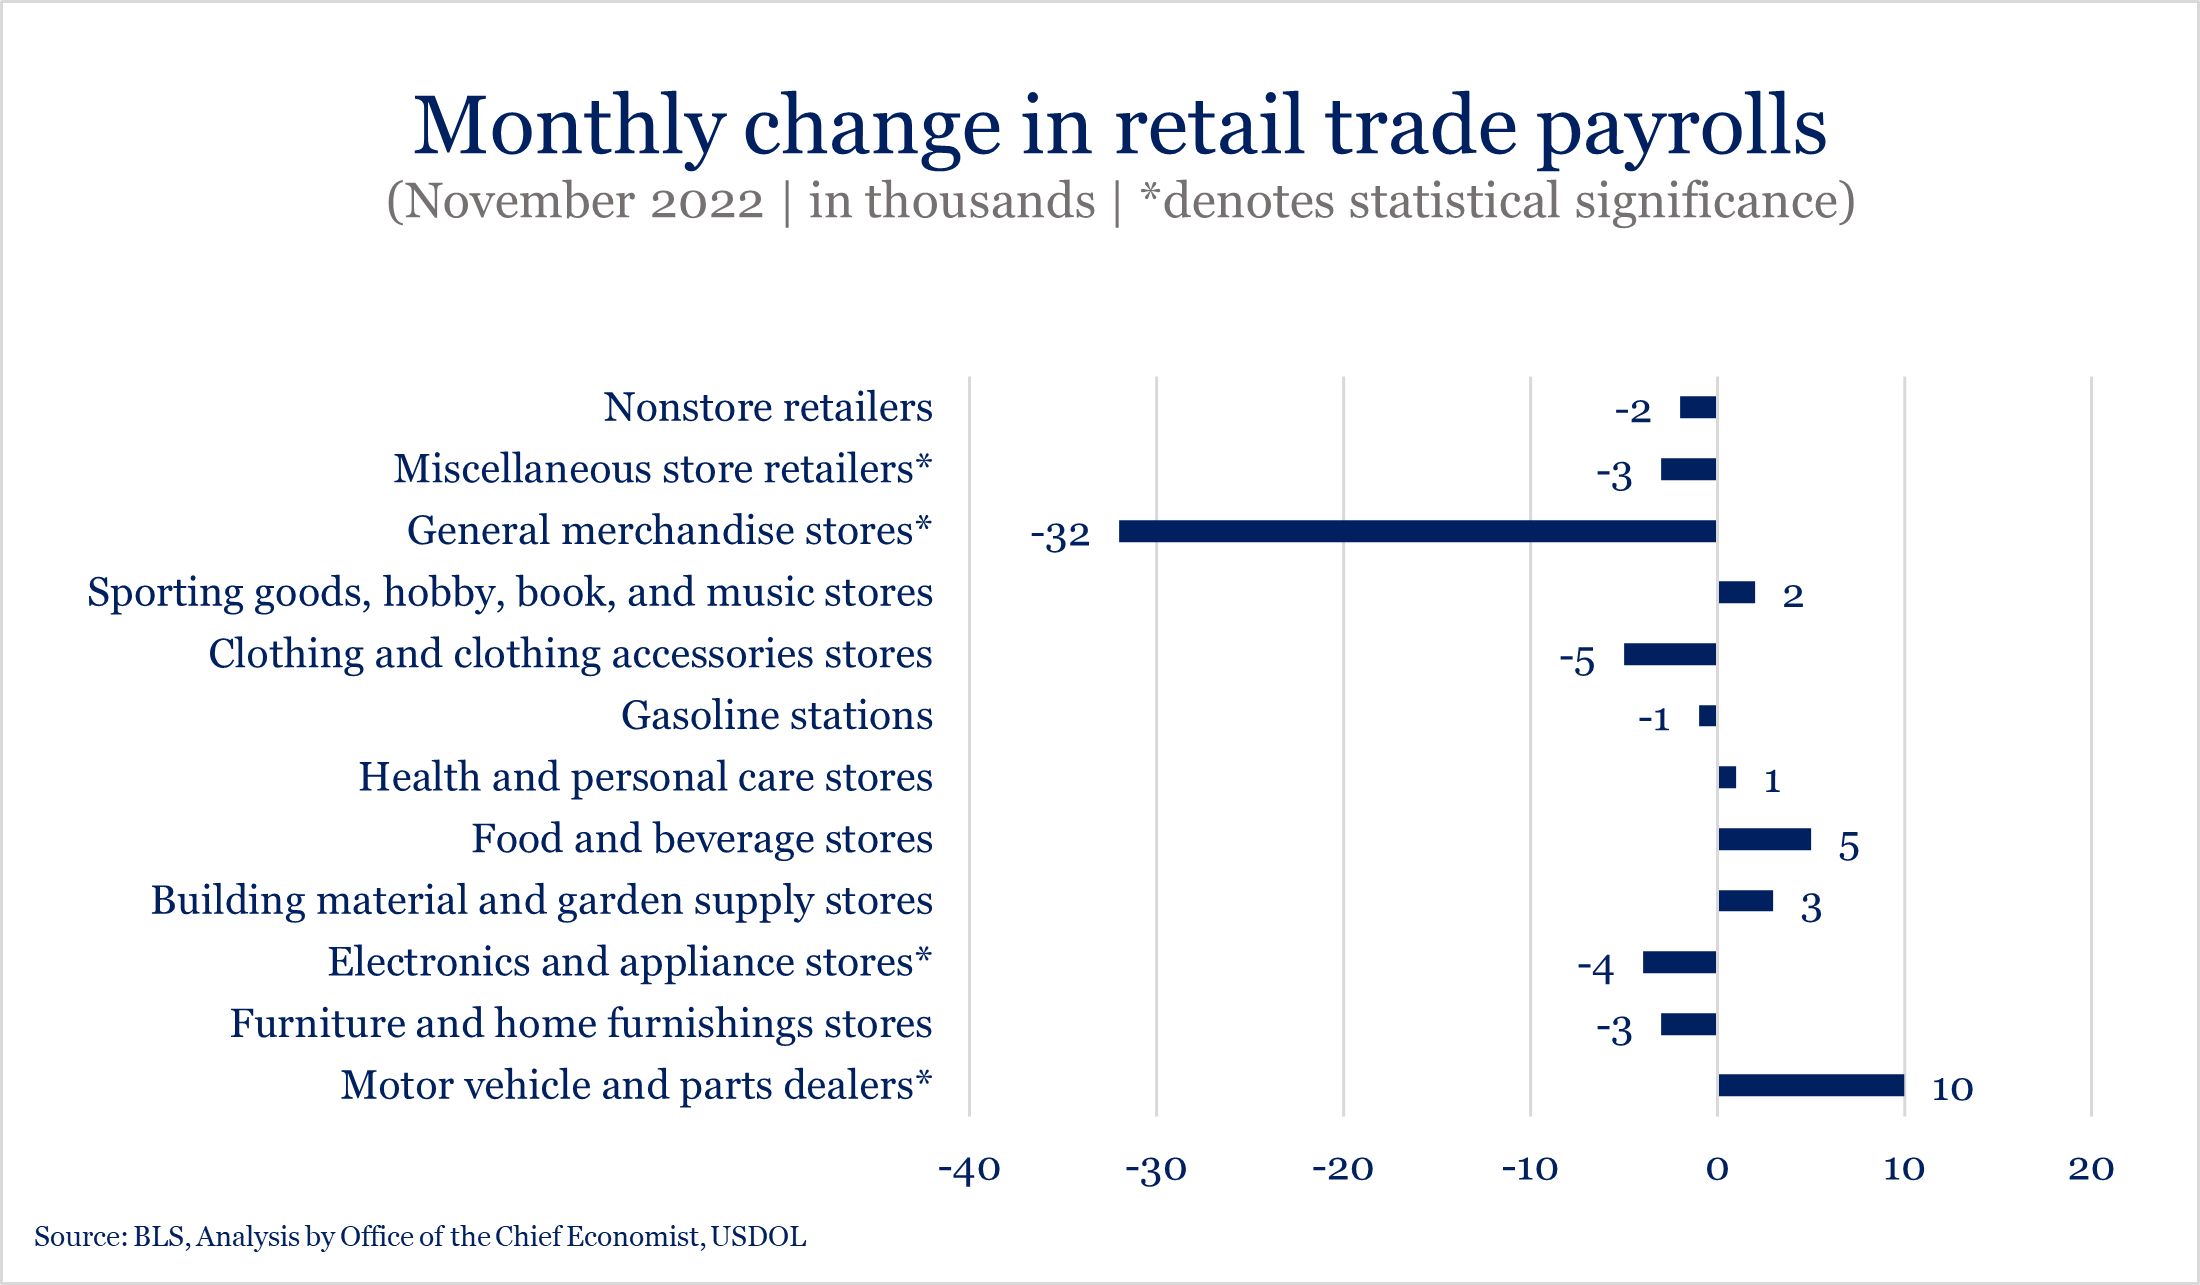
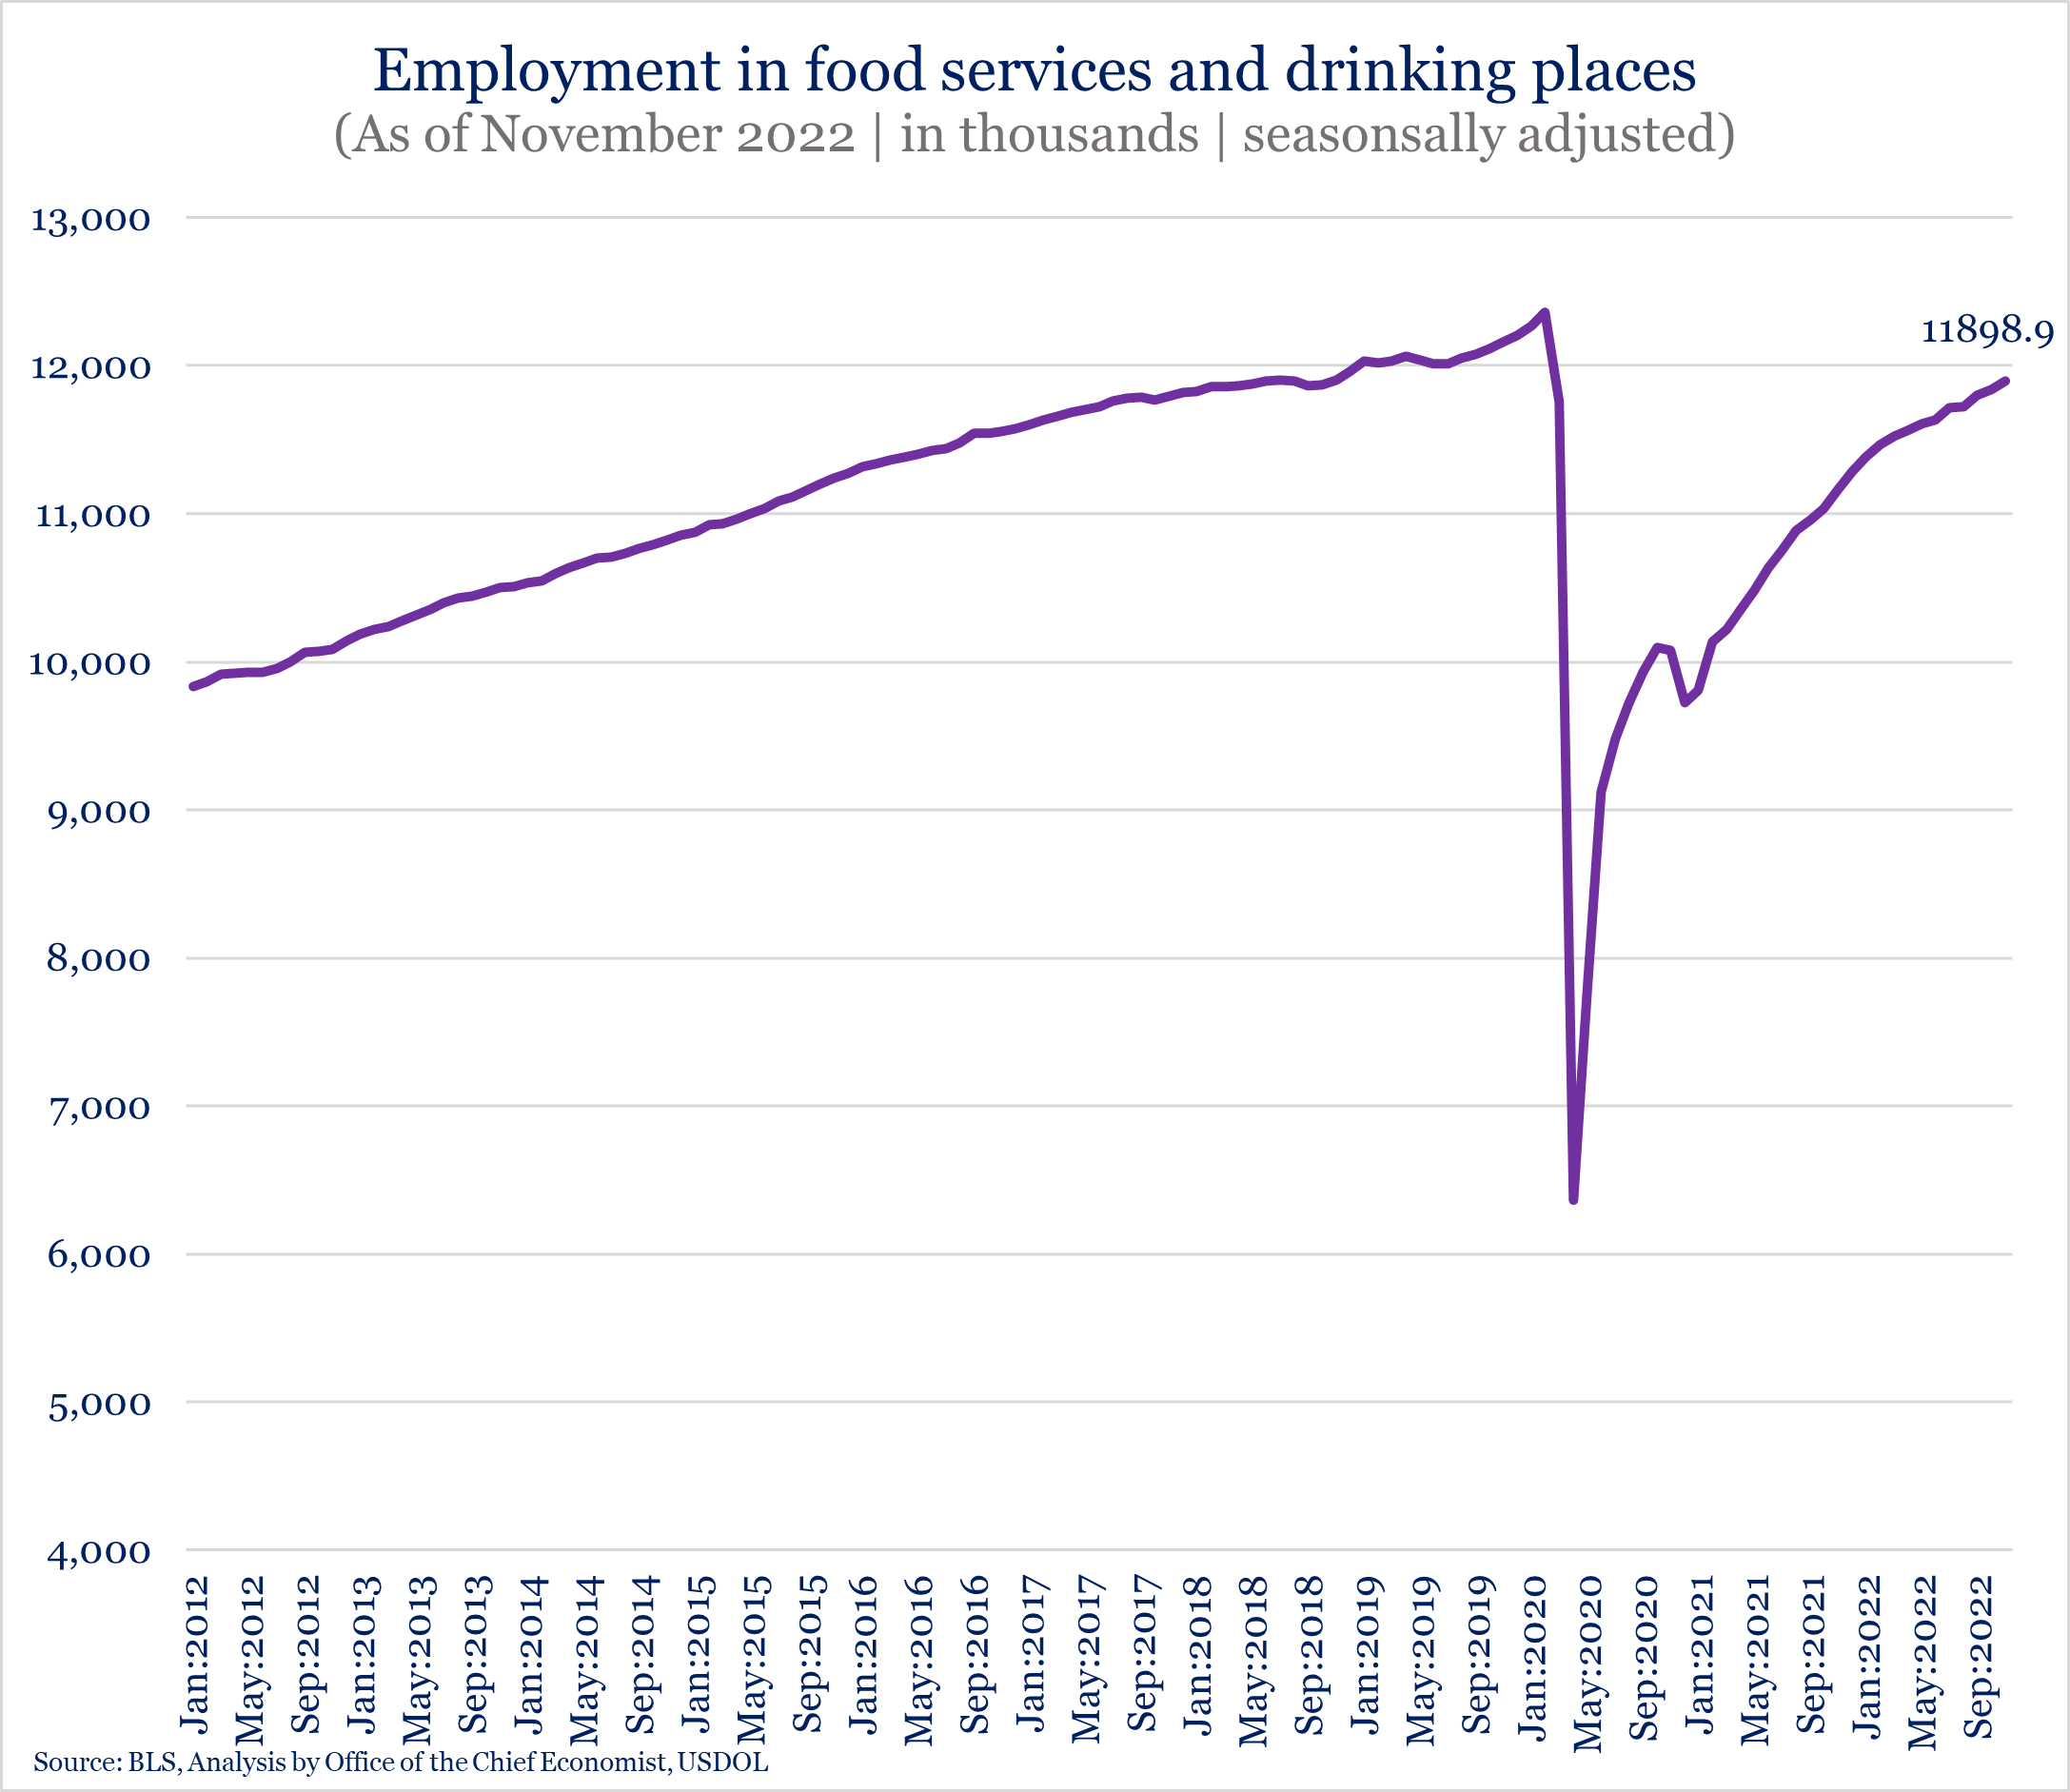
The leisure and hospitality sectors had larger gains in recent months (+88K in November), though they still remain below their pre-pandemic level, she noted. Food services and drinking places (+62K) drove much of November’s increase.
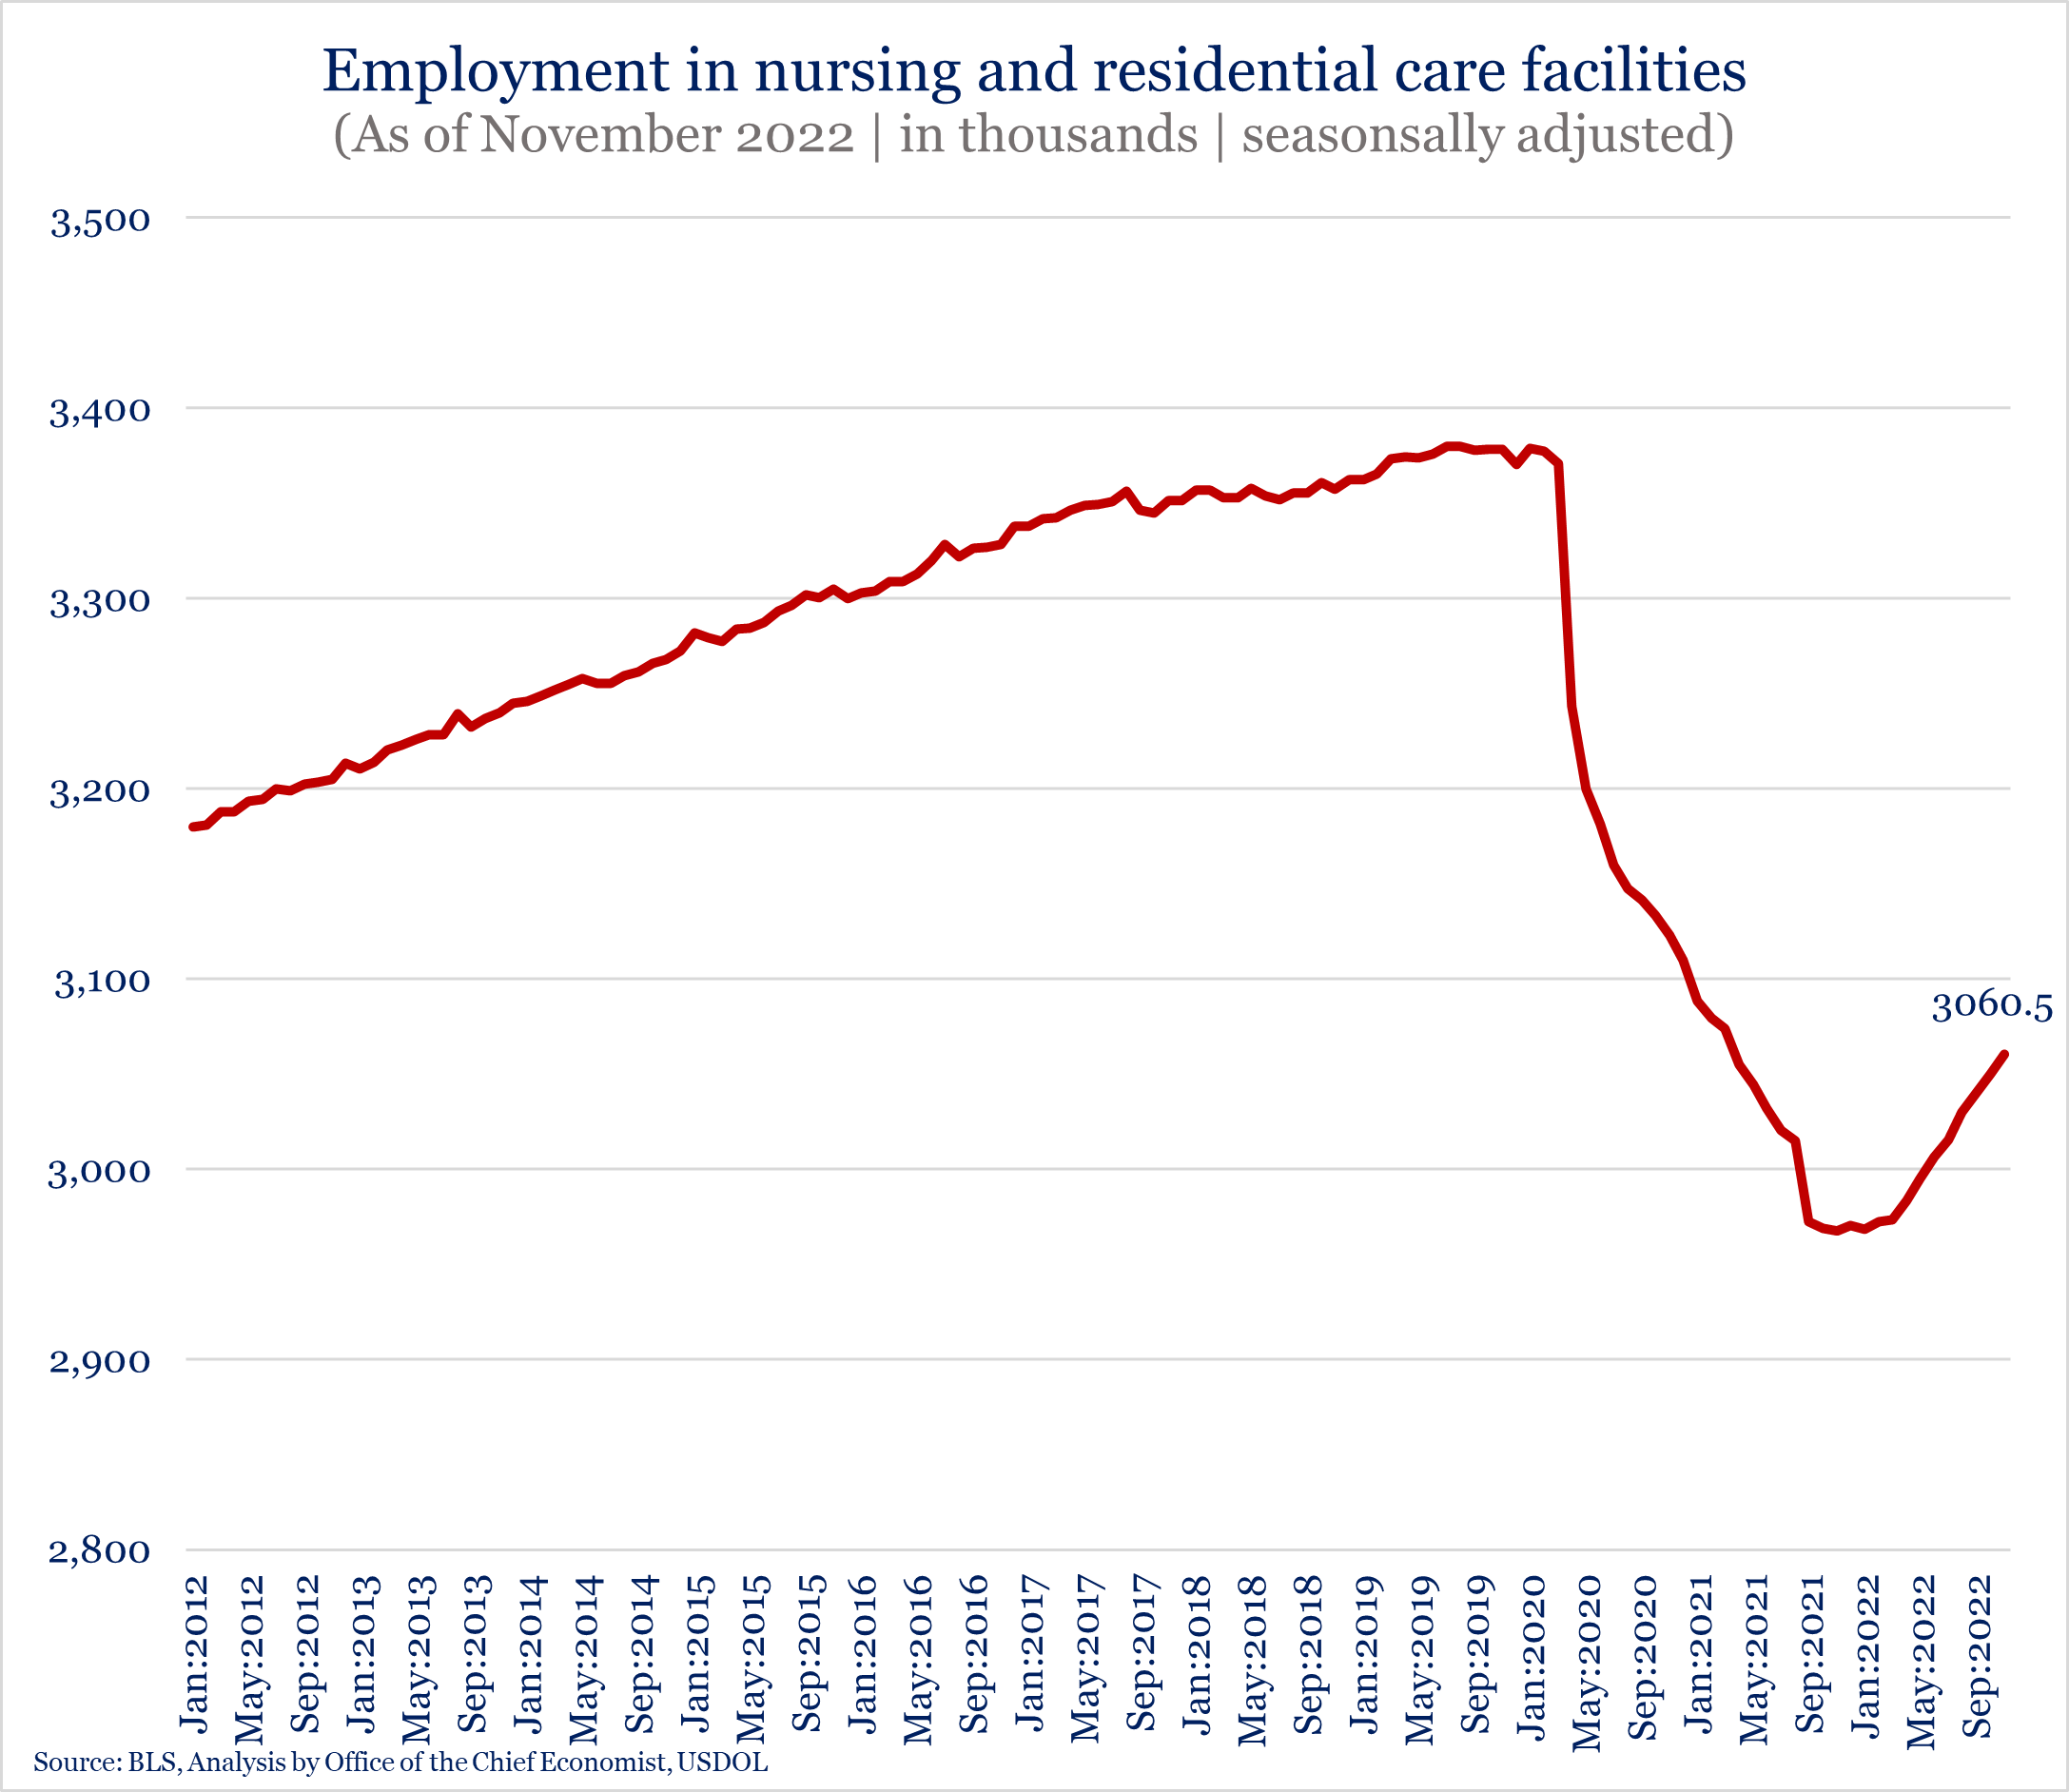
Nursing and residential care facilities grew (+10K) in November, continuing the climb from a drop in employment that continued even after the pandemic recovery began, Economist Gamble pointed out. However, employment in those sectors was still well below the pre-pandemic level.
Unemployment Rate Changes Continued to Vary Among the Major Worker Groups with Significant Rate Drop for Individuals with Disabilities
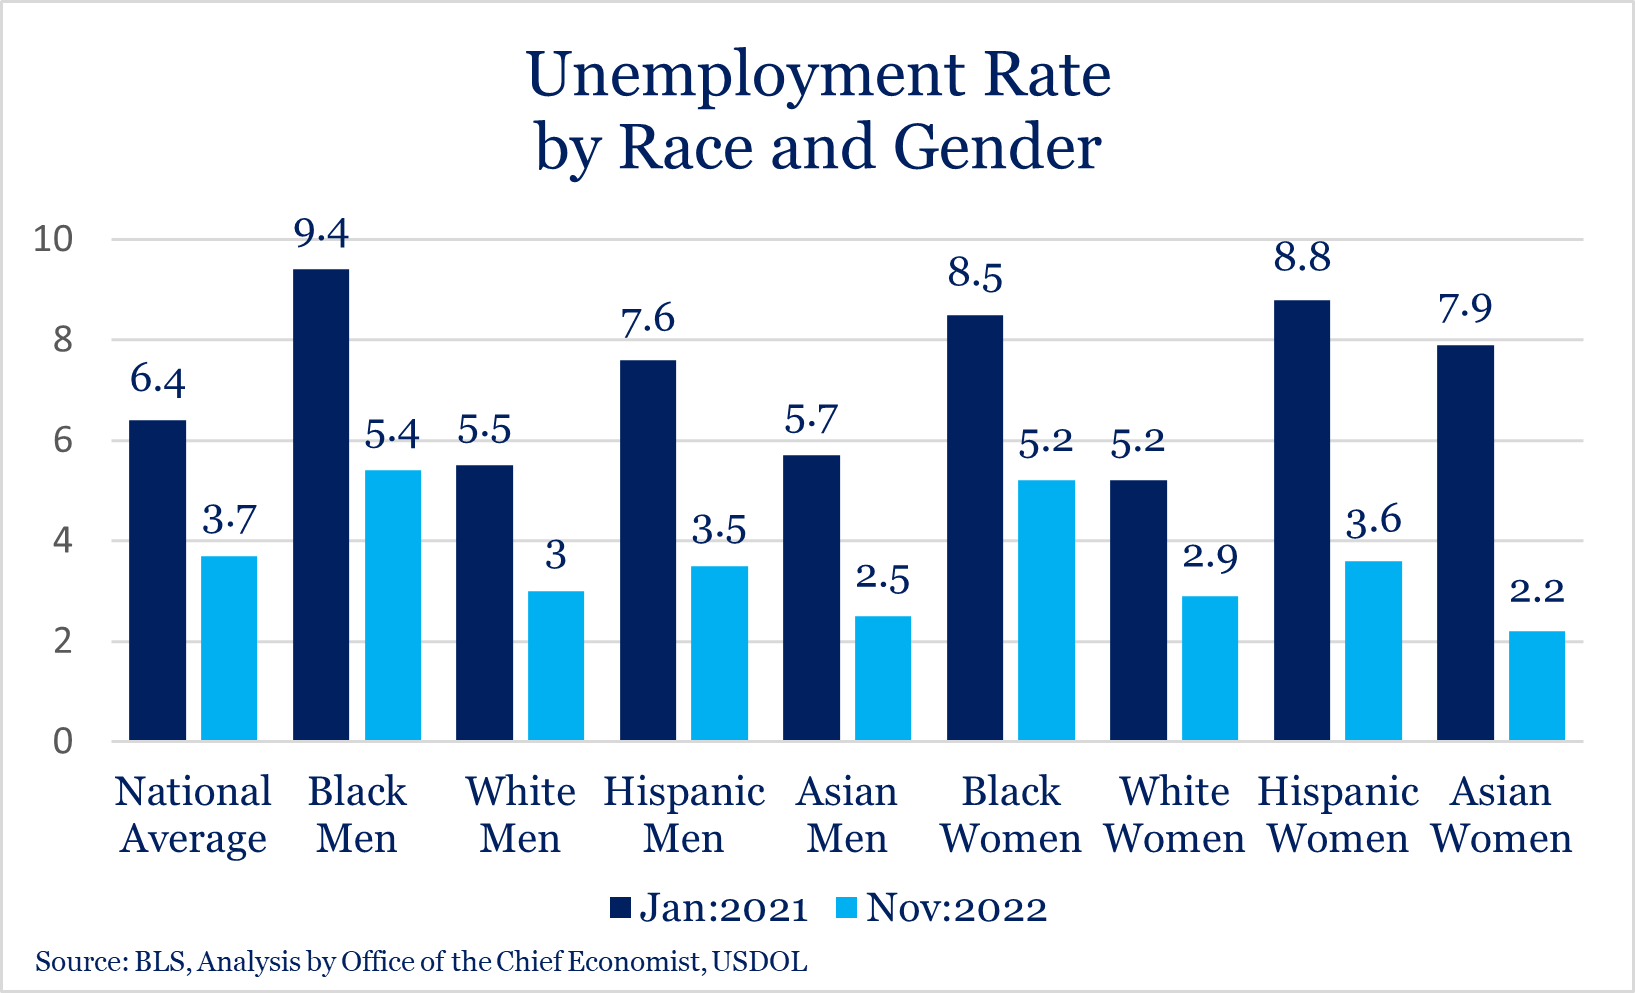
Economist Gamble concluded her thread by noting that unemployment rates by race and gender “remain near historic lows,” but disparities between groups still persist. She shared the following chart to show the numbers by race/gender for groups with large sample sizes:
USDOL tweeted the following chart of the November rates among the major worker groups:
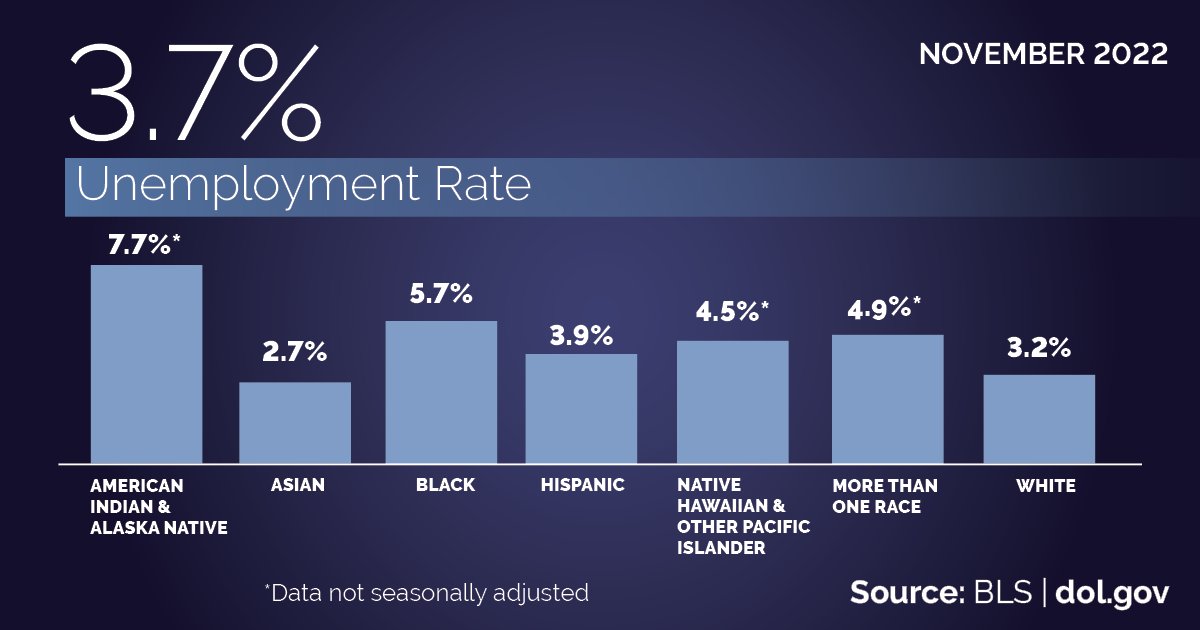
Our chart below further details the rate changes among the major worker groups:
|
The Employment Situation – November 2022 |
||||
| Unemployment Rate | September 2022 | October 2022 | November 2022 | Feb 2020 Pre-Pandemic |
| National (Seasonally adjusted) |
3.5% | 3.7% | 3.7% | 3.5% |
| White | 3.1% | 3.2% | 3.2% | 3.0% |
| Black | 5.8% | 5.9% | 5.7% | 6.0% |
| Asian | 2.5% | 2.9% | 2.7% | 2.5% |
| Hispanic (Seasonally adjusted) |
3.8% | 4.2% | 3.9% | 4.4% |
| Native Hawaiians & Other Pacific Islanders | 3.7% | 3.1% | 4.5% | 2.7% |
| Two or More Races (Not seasonally adjusted) |
6.4% | 5.5% | 4.9% | 6.1% |
| Men (20+) | 3.3% | 3.3% | 3.4% | 3.2% |
| Women (20+) (Seasonally adjusted) |
3.1% | 3.4% | 3.3% | 3.1% |
| Veteran (Not seasonally adjusted) |
2.6% | 2.5% | 2.8% | 3.7% |
| Individuals with Disabilities (Not seasonally adjusted) |
7.3% | 7.4% | 5.8% | 7.8% |
As the above chart shows, the most dramatic change was the unemployment rate for Individuals with Disabilities at 5.8 percent in November, a significant drop from the 7.4 percent rate in October.
BLS has additional, interactive graphs available here.
See Also
- President Biden’s remarks
- U.S. Secretary of Labor Marty Walsh’s remarks
- USDOL Chief Economist Joelle Gamble’s full Twitter thread of observations
- BLS Commissioner William W. Beach’s statement
- White House Counsel of Economic Advisers’ blog
In Brief
Tuesday, November 29, 2022: U.S. NLRB Extended by One Month Initial and Reply Comment Periods on Its Proposed “Fair Choice and Employee Voice Rule”
 The U.S. National Labor Relations Board (NLRB) extended the comment periods by one month on its proposed “Fair Choice and Employee Voice” Rule. Now, initial comments on the proposal are due by February 2, 2023, instead of January 3, 2023. The deadline for comments in response to the comments submitted during the initial comment period is now February 16, 2023, instead of January 17, 2023. Stakeholders may submit comments here. The extension was first announced in a press release Tuesday, two days prior to the Federal Register notice published on Thursday.
As we reported last month, the proposed Rule would rescind the current Final Rule adopted by the prior Board majority in 2020. Specifically, it would rescind and replace the 2020 amendments to the Board’s rules and regulations governing blocking charges and the voluntary-recognition bar doctrine and rescind the amendment governing proof of majority support for labor organizations representing employees in the construction industry.
Looking Ahead:
Upcoming Date Reminders
Wednesday, December 7, 2022: Deadline to submit initial comments on NLRB’s proposed Rule to Determine Joint Employer Status (previous November 7 deadline extended) – https://www.regulations.gov/docket/NLRB-2022-0001
Tuesday, December 13, 2022: Comments due on USDOL WHD proposed rule on “Employee or Independent Contractor Classification Under the Fair Labor Standards Act” (previous November 28 deadline extended) – https://www.regulations.gov/docket/WHD-2022-0003
Wednesday, December 21, 2022: Deadline to submit reply comments in response to initial comments on NLRB’s NPRM to Determine Joint Employer Status (previous November 21 deadline extended) – https://www.regulations.gov/docket/NLRB-2022-0001
Sunday, January 1, 2023: The minimum wage for federal contracts covered by Executive Order 13658 (“Establishing a Minimum Wage for Contractors”) (contracts entered into, renewed, or extended prior to January 30, 2022), will increase to $12.15 per hour, and the minimum cash wage for tipped employees increases to $8.50 per hour – https://www.federalregister.gov/documents/2022/09/30/2022-20905/minimum-wage-for-federal-contracts-covered-by-executive-order-13658-notice-of-rate-change-in-effect
Sunday, January 1, 2023: The minimum wage for federal contractors covered by Executive Order 14026 (“Increasing the Minimum Wage for Federal Contractors”) (contracts entered into on or after January 30, 2022, or that are renewed or extended on or after January 30, 2022), will increase to $16.20 per hour, and the minimum cash wage for tipped employees increases to $13.75 per hour – https://www.federalregister.gov/documents/2022/09/30/2022-20906/minimum-wage-for-federal-contracts-covered-by-executive-order-14026-notice-of-rate-change-in-effect
Monday, January 9, 2023: Comments due on US EEOC proposal to eliminate counting employees to determine filing “type” for EEO-1 Survey Component 1 – https://www.regulations.gov/document/EEOC-2022-0005-0001
Tuesday, January 17, 2023: Comments due on OFCCP’s Proposed Changes to Disability Self-Identification Form to Update Preferred Language for Specific Disabilities – https://www.regulations.gov/commenton/OFCCP-2022-0003-0004
Friday, January 20, 2023: Deadline to submit comments on OFCCP’s Proposed Changes to Its Supply & Service Contractor ICRs, Including Use of Portal to Submit Revised Scheduling Letter & Revised Itemized Listing Responses – https://www.regulations.gov/commenton/OFCCP-2022-0004-0001
Thursday, February 2, 2022: Deadline to submit initial comments on NLRB’s proposed changes to NLRA regulations (previous January 3 deadline extended) – https://www.regulations.gov/commenton/NLRB-2022-0002-0001
Thursday, February 16, 2022: Deadline to submit reply comments in response to initial comments on NLRB’s proposed changes to NLRA regulations (previous January 17 deadline extended) – https://www.regulations.gov/commenton/NLRB-2022-0002-0001
Wednesday, April 12 – Friday, April 14, 2023: DEAMcon23 Chicago (Registrations open now; Agenda now available here!)

THIS COLUMN IS MEANT TO ASSIST IN A GENERAL UNDERSTANDING OF THE CURRENT LAW AND PRACTICE RELATING TO OFCCP. IT IS NOT TO BE REGARDED AS LEGAL ADVICE. COMPANIES OR INDIVIDUALS WITH PARTICULAR QUESTIONS SHOULD SEEK ADVICE OF COUNSEL.
SUBSCRIBE.
Compliance Alerts
Compliance Tips
Week In Review (WIR)
Subscribe to receive alerts, news and updates on all things related to OFCCP compliance as it applies to federal contractors.
OFCCP Compliance Text Alerts
Get OFCCP compliance alerts on your cell phone. Text the word compliance to 55678 and confirm your subscription. Provider message and data rates may apply.