
 This is Part I of a Four-Part Series (the next three parts will appear one-per-week in the next three Week In Review publications)
Part A: Overcoming the Coming Minority Professionals Pipeline Problem
The SCOTUS Harvard/UNC case decision reported that only about 25% of institutions of higher learning (universities and colleges) in the United States have been undertaking race-based and national origin-based admission decisions. I have previously seen uncertain reports that perhaps 100 colleges and universities have undertaken race/national origin-based admission practices. So, the SCOTUS report could be correct.
However, the volume of the race/national origin-based admissions the universities have reported in the lawsuits which have reached the SCOTUS have been quite large as a percentage and a number (from 2% of the entering class to a more typical 10% (Harvard; University of Michigan Law School), 16% at UC Davis Medical School, and 25%, at UNC).
The litigated database is of course quite small. Apart from the uncertainty about how many colleges and universities have undertaken race/national origin-based admission practices, no one knows whether the litigated case admission preferences practices are representative of all colleges and universities which have used race/national origin-based admission practices.
Regardless how you count, it appears certain that a significant number of African American and Hispanic candidates for colleges and universities will be affected. Indeed, without quantifying their concerns, both Harvard and UNC argued to the SCOTUS, for example, that there was a large need to continue race/national origin-based admission practices. Both schools also argued that the result of returning to “colorblind” admission policies would have a large impact on the diversity of their admissions. As a result, employers will eventually be affected as they look out their recruiting doors in coming years to find that the diversity of their applicant pools for professional, technical, and managerial positions has shrunken noticeably.
UNC’s race-based/national origin-based admission practices led annually to the admissions of about a thousand students at UNC alone according to the SCOTUS Majority Opinion, discussed more fully below (with which five other Justices joined for a total of 6 of the 9 Justices). These are students who would not otherwise have been admitted to UNC but for their race/national origin. One can only speculate how many tens of thousands of Black and Hispanic graduates were admitted to colleges and universities based on their race/national origin who now will not be admitted to those same colleges and universities going forward. When one adds up the affected admission decisions of almost 100 universities and colleges which have reportedly engaged in race/national origin-based admission decisions in the last two decades since the SCOTUS “greenlighted” certain narrowly prescribed race-based admission practices, the annual total is unknown (to anybody) but is obviously going to be a very big number. One hundred times anything but zero is a big number. 100 x 10 students = 1,000. 100 x 100 students = 10,000. 100 x 1,000 = 100,000.
Now that lawful race-based/national origin-based preferences are cut-off as of this Fall’s admission decision-making cycle to admit students for the Fall 2024 entering classes, the graduating classes of 2028 will look QUITE different from a diversity perspective to prospective employers than they have for the last decade-plus.
In Part B, below, we discuss what employers might start doing now to mitigate that coming drop-off of diversity in their professional, technical/managerial applicant flows beginning in 2028. The bottom half of Part B also reports the latest graduation rates, by race and national origin for both college/university graduations and for high schools in the United States. Spoiler Alert: Asians continue to graduate in higher percentages, followed by Whites, and then drop back significantly to Hispanics and then to African Americans and then Native Americans.
This Part A attempts to merely size the coming diversity shortfalls employers might reasonably confront in a very short 3 or 4 years, as described below.
Some examples follow to provide some rough context and to illustrate the coming minority professionals, technical, executive pipeline problem now scheduled to reach the front doors of employers (beginning in the Fall of 2027 when most employers start hunting for their student hires to graduate the following year to fill professional positions in mid-2028). We have also interlaced some examples of what has previously happened, in the real world, when race-based university admission preferences stopped.
1978: The University of California at Davis Medical School set a preference for African Americans of 16% of its entering class of medical doctors (16 seats in the then 100 seat Medical School class). The SCOTUS struck down this admission practice, which did not cause Black applicants to compete with non-Black applicants for admission) as an unlawful “quota.” Ending the quota reportedly immediately thereafter reduced ensuing classes to one or two African American admittees.
1996: The University of California – Abolition of race/national origin-based admission practices at the University of California as a result of the passage of Proposition 209 (amending California’s Constitution to ban the use of race in all state programs) resulted in a reduction of minority enrollment of approximately 12% system-wide throughout the 9-campus UC university system. See the UC’s Bleemer report. In 1996, UC enrolled over 162,000 students to its entering classes in the undergraduate and graduate divisions. See UC’s Fall Admissions report. 12% x 162,000 = 19,440 students.
The prestigious law school (then named Boalt Hall; renamed in 2020) at the UC’s headquarter campus in Berkeley, California where I used to recruit first-year lawyers, traditionally had 14 or so Black students in its then approximately 275 student graduating law school class. Immediately after the passage of Prop 209, the admission of Black students to then Boalt Hall dropped to an average of two…a 7x drop.
2003: The University of Michigan Law School’s race/national origin-based admission practices—which the SCOTUS upheld in its 2003 Grutter decision with specific recipe-like instructions as to pitfalls to avoid constitutional law violations—reported that it caused the entering (1L) class in 2003 to be slightly over 14% Black, but would have been slightly over only 4% without the race/national origin-based admission preference practices (resulting in a race/national origin based preference of about 10% of the entering class). The Law School entering (1L) class is typically about 350 students according to the SCOTUS’ Grutter case decision. 10% x 350 seats in the entering class=about 35 race/national origin-based admissions per year.
2003: The University of Michigan Undergraduate Schools awarded 20 admission points to “underrepresented minorities” (African Americans, Hispanics, and Native American Indians) on a 100-point admission scale. The effect of this race/national origin-based preference was that it guaranteed the admission of almost all “underrepresented applicants” because they were then deemed “qualified” for admission within the UofM’s admission Guidelines after adding the 20-point race/national origin bump. The UofM admitted that it admitted to the undergraduate school “virtually every qualified” underrepresented applicant in the 1995-1996 school year (443 Blacks and 229 Hispanics).
Because of this practice, which the SCOTUS struck down as a form of unlawful “quota,” it is not known what percentage of the undergraduate class applicants who were Black, Hispanic, or Native American would have otherwise been admitted to the undergraduate school without the addition of the 20-point race/national origin admission preference. The University of Michigan’s then undergraduate class for 1995 (the first of two of the years in contention in the Gratz lawsuit successfully challenging the University of Michigan’s undergraduate admission practices) was composed of 51,213 students. See UofM, Historic Enrollment Data for 1995-1996 at p. 6 of 23. Even assuming the worst case (that none of the Black, Hispanic and Native American students would have been admitted without the 20-point race/national origin admission preference), this was a small volume preference of only about 1.3% of the entering Freshman undergraduate class (443+229=673 divided by 51,213).
2023: Harvard University’s race/national origin-based admission preferences added about 160 African American and Hispanic students to Harvard’s entering freshman undergraduate class for apparently more than a decade according to Justice Gorsuch’s Concurring Opinion in the Harvard/UNC case decision citing to the Federal District Court’s factual findings and conclusions of law in the Harvard trial (see his Slip Opinion at pp 9-10):
“’Race conscious admissions will always penalize to some extent the groups that are not being advantaged by the process.’” 397 F. Supp. 3d, at 202–203.
Consider how this plays out at Harvard. In a given year, the university’s undergraduate program may receive 60,000 applications for roughly 1,600 spots.
* * * * * *
All told, the district court made a number of findings about Harvard’s use of race-based tips. For example: “[T]he tip[s] given for race impac[t] who among the highly qualified students in the applicant pool will be selected for admission.” Id., at 178. “At least 10% of Harvard’s admitted class . . . would most likely not be admitted in the absence of Harvard’s race-conscious admissions process.” Ibid. Race-based tips are “determinative” in securing favorable decisions for a significant percentage of “African American and Hispanic applicants,” the “primary beneficiaries” of this system. Ibid. There are clear losers too. “[W]hite and Asian American applicants are unlikely to receive a meaningful race-based tip,” id., at 190, n. 56, and “overall” the school’s race-based practices “resul[t] in fewer Asian American and white students being admitted,” id., at 178. For these reasons and others still, the district court concluded that “Harvard’s admissions process is not facially neutral” with respect to race. Id., at 189–190; see also id., at 190, n. 56 (“The policy cannot . . . be considered facially neutral from a Title VI perspective.”).”
So, taking Justice Gorsuch’s report of the District Court’s findings, 10% x 1600 seats in Harvard’s entering Freshman class = 160 African Americans and Hispanic students who will not be admitted to Harvard in 2024 and who will not be graduating in 2028 for employers to then harvest.
2023: UNC’s trial resulted, I thought, in an uncertain number and percentage of “underrepresented minorities” (defined below) who UNC would not have admitted but for their race/national origin. However, Justice Sotomayor in her Dissenting Opinion in the Harvard/UNC case decision reported that the District Court (the trial Judge) “found” two percentages that drove race/national origin-based admission “decisions” (that word is important, as discussed below). When one applies those percentages to the number of applicants elsewhere reported in the Court’s factual findings, one gets a percentage of diverse students who benefited from UNC’s race/national origin-based admission practices entering UNC’s 4200-seat undergraduate class of approximately 25%. Here is what we know.
First Justice Gorsuch:
“In a typical year, about 44,000 applicants vie for 4,200 spots. 567 F. Supp. 3d, at 595.” (See Gorsuch Concurring Op at p. 10).
* * * * * *
The district court found that “UNC’s admissions policies mandate that race is taken into consideration” in this process as a “‘plus’ facto[r].” Id., at 594– 595. It is a plus that is “sometimes” awarded to “underrepresented minority” or “URM” candidates—a group UNC defines to include “‘those students identifying themselves as African American or [B]lack; American Indian or Alaska Native; or Hispanic, Latino, or Latina,’” but not Asian or white students. Id., at 591–592, n. 7, 601. At UNC, the admissions officers’ decisions to admit or deny are “‘provisionally final.’” Ante, at 4 (opinion for the Court). The decisions become truly final only after a committee approves or rejects them. 567 F. Supp. 3d, at 599. That committee may consider an applicant’s race too. Id., at 607. In the end, the district court found that “race plays a role”—perhaps even “a determinative role”—in the decision to admit or deny some “URM students.” [emphasis added: EDITORIAL NOTE: you will see why later when you get to Justice Sotomayor’s offering on this issue of the extent and impact of UNC’s race/national origin-based admission practices] Id., at 634; see also id., at 662 (“race may tip the scale”). (See Gorsuch Concurring Op at pp. 10-11).
Second, next up, Chief Justice Roberts:
“Respondents [Harvard and UNC] also suggest that race is not a negative factor because it does not impact many admissions decisions. See id., at 49; Brief for University Respondents in No. 21– 707, at 2. Yet, at the same time, respondents also maintain that the demographics of their admitted classes would meaningfully change if race-based admissions were abandoned. And they acknowledge that race is determinative for at least some—if not many—of the students they admit. See, e.g., Tr. of Oral Arg. in No. 20–1199, at 67; 567 F. Supp. 3d, at 633. How else but “negative” can race be described if, in its absence, members of some racial groups would be admitted in greater numbers than they otherwise would have been? The “[e]qual protection of the laws is not achieved through indiscriminate imposition of inequalities.” Shelley, 334 U. S., at 22.” [footnote 6 goes here]
This is footnote 6, which sets off a war of footnotes with Justice Sotomayor [who will be up next]:
“JUSTICE JACKSON contends that race does not play a ‘determinative role for applicants’ to UNC. Post, at 24. But even the principal dissent [who is Justice Sotomayor] acknowledges that race—and race alone—explains the admissions decisions for hundreds if not thousands of applicants to UNC each year. [emphasis added] Post, at 33, n. 28 (opinion of SOTOMAYOR, J.); see also Students for Fair Admissions, Inc. v. University of N. C. at Chapel Hill, No. 1:14–cv–954 (MDNC, Dec. 21, 2020), ECF Doc. 233, at 23–27 (UNC expert testifying that race explains 1.2% of in state (sic) and 5.1% of out of state admissions decisions); 3 App. in No. 21–707, at 1069 (observing that UNC evaluated 57,225 in state (sic) applicants and 105,632 out of state applicants from 2016–2021).”
Editorial Note: These in-state and out-of-state applicant numbers are important since they are the multipliers for the percentages of admission “decisions” which were driven by race or national origin.
- 1.2% x 57,225=686 applicants admitted based on their race/national origin from the in-state applicant pool during the 6-year period at-issue in the litigation. These are reportedly admission “decisions” [NOT seats in the entering class…i.e., NOT 1.2% x 4,200 seats] as Chief Justice Roberts reports the Expert Witnesses finding;
- 5.1% x 105,632=5,387 applicants admitted based on their race/national origin from the out-of-state applicant pool during the 6-year period at-issue in the litigation. These are reportedly admission “decisions” [NOT seats in the entering class…i.e., NOT 5.1% x 4200 seats] as Chief Justice Roberts reports the Expert Witnesses finding;
So, if these data are correct as the District Court (the trial court) found (see Sotomayor decision, below), about 1,012 applicants would have been admitted to UNC each year (686+5,387=6,073 race/national origin-based admission decisions for the six-year period. 6,073 divided by 6-years=1,012/yr) based on their race/national origin [= almost 25% of the approximately 4,200 entering undergraduate class UNC admitted to the campus each year.
If what the District Court found was 1.2% of the entering class as seated, the math would look like this:
1.2% x 4,200 = 50 race/national origin-based admissions/yr
5.1% x 4,200 = 214 race/national origin-based admissions/yr
Third, and finally, here is Justice Sotomayor:
In the second half of her footnote 28 [see Justice Sotomayor’s Dissenting Opinion at p. 33] which Chief Justice Roberts called out, as noted above, she crossed swords with him, as follows:
“The District Court in the UNC case found that “race plays a role in a very small percentage of decisions: 1.2% for in-state students and 5.1% for out-of-state students.” 567 F. Supp. 3d 580, 634 (MDNC 2021). [Editor emphasis added] The limited use of race at UNC thus has a smaller effect than at Harvard and is also consistent with the Court’s precedents. In addition, contrary to the majority’s suggestion, such effect does not prove that “race alone . . . explains the admissions decisions for hundreds if not thousands of applicants to UNC each year.” Ante, at 28, n. 6. As the District Court found, UNC (like Harvard) “engages a highly individualized, holistic review of each applicant’s file, which considers race flexibly as a ‘plus factor’ as one among many factors in its individualized consideration of each and every applicant.” 567 F. Supp. 3d, at 662; see id., at 658 (finding that UNC “rewards different kinds of diversity, and evaluates a candidate within the context of their lived experience”); id., at 659 (“The parties stipulated, and the evidence shows, that readers evaluate applicants by taking into consideration dozens of criteria,” and even SFFA’s expert “concede[d] that the University’s admissions process is individualized and holistic”). Stated simply, race is not “a defining feature of any individual application.” Id., at 662; see also infra, at 48.”
Editorial Note: That last sentence spars with her own report at the beginning of the footnote reporting what the District Court found:
“The District Court in the UNC case found [emphases added] that “race plays a role in a very small percentage of decisions: 1.2% for in-state students and 5.1% for out-of-state students.” 567 F. Supp. 3d 580, 634 (MDNC 2021).”
The problem with that observation, too, is that while the percentages seem small, the numbers of race/national origin-based admission “decisions”-NOT seats in the class (which Roberts/Sotomayor and the District Court reference) is very large. [As the former Prime Minister of Great Britain, Benjamin Disraeli (1874-1880) once famously said: “There are three types of lies: lies, damn lies and statistics”.] So, statistics are often very confusing. In this case, the percentage of times race/national origin controlled the admission “decision” (as found by the trial Judge based on Expert testimony) multiplied by the large volume of applicants results in a very large number of race/national origin-based admission “decisions” relative to the relatively smaller (not small) number of entering class seats UNC had available to fill each year (4,200). To make sense of Justice Sotomayor’s footnote, I very much think she thought the District Court’s decision reporting 1.2 % and 5.1% selection rates based-on race/national origin applied to seats in the class, and not to admission “decisions.” If she thought that, it gives meaning to her footnote conclusion that “…’race plays a role in a very small percentage of decisions’”.
2023: The University of Texas at Austin is another big school and was, until the Harvard/UNC case decision, the only state school in Texas considering race in its admissions process. That obviously must now stop, in addition to the Harvard/UNC case decision, because Texas state law now bans (as of 2023) race/national origin-based admission practices. The June 29, 2023 edition of the Texas Tribune online newspaper quoted a Ms. Stella Flores, a “higher education and public policy expert” at UT-Austin, saying that:
“[t]he [Harvard/UNC] ruling would ‘decimate’ the pool of students of color, particularly in areas like graduate school, science, technology, engineering and medical fields’” at UT-Austin.
In 2023, there are almost 52,000 students enrolled at UT Austin (alone), the “flagship institution of the University of Texas.” The University of Texas system enrolled a record almost quarter-million students in the Fall of 2022. The other state of Texas University, Texas A&M University, has over 152,000 students across its now many campuses. (Everything is bigger in Texas!)
Punchline to End Part A
A 25% drop-off in minority students out of a big school like UNC would be noticeable in employer professional/executive job applicant pools, if that is what is coming. And that is true even before one extrapolates the coming diversity candidate drop-offs for professional/technical/executive jobs from the approximately 100 other universities and colleges around the United States which have been pumping up their minority graduate counts with what in the future will be illegal race/national origin-based admissions practices. Compliance, Diversity, and Talent Acquisition Managers have their work cut out for them to maintain recruitment pools with qualified diverse races and national origins.
Let’s now turn to a practical discussion of how.
Part B: “Life Preserver” Practical Next Step Suggestions
This Part B is in two parts:
- A “Call to Arms” for ILGs; and
- A catalog report of the latest High School and College/University Graduation Rates (to show the depth of the problem of diversity hires for professional, technical, and executive positions). These reports underscore the need for immediate and forceful new actions to “level the academic playing field” and feed companies with qualified Black, Hispanic and Native American employees.
Whatever the size and dimension of the Pipeline problem of minimally qualified African American, Hispanic, and Native American workers for professional, technical, and managerial jobs, it was big BEFORE the Harvard and UNC decision and in a short four years will be BIGGER yet. The size of the problem, whatever it is precisely, calls for both new thinking and renewed and redoubled efforts.
Here is my starter list of actions federal contractors and employers should consider taking:
1. Call To Arms to The Industrial Liaison Groups (ILGs): Add “Pipeline Projects” To Your Mission Statement
Broad Suggestion:
When “Industrial Liaison Groups” (the original name for what we today refer to as “Industry Liaison Groups”) or “ILGs” were created, they were meant to be a partnership between OFCCP and the federal contractor community to create a neutral forum to exchange compliance information and advice OUTSIDE the context of the 7,000+ audits per year often (then) head-knocking and lengthy (with typically 3-4 day on-site audits and with typically 3-8 OFCCP Compliance Officers),
The hope for these ILGs, created over 40 years ago, was for the ILGs to run their own shop and to set their own compass and direction without OFCCP involvement or interference and work together to share best practices and learn from one another as to how to effectively handle those very tough compliance evaluations.
Today, I believe there is another great opportunity for these groups. I suggest EVERY ILG add to its educational mission one or more ongoing “Projects,” especially “Pipeline Projects.” The ILGs should be at the forefront to help build the needed pipeline of minority students to be competitive for workplace hiring requirements that ILG members know intimately. The objective would be to increase the percentage of high school and college/university graduation percentages of Black, Hispanic, and Native American students to more closely resemble the graduation percentages of Asians and Whites.
Specific Suggestion #1: ILG Members should start tutoring Black, Hispanic and Native American students in math and English. Change starts with you, not the person next to you. Even only 25 ILG Members tutoring could potentially change for the positive the career direction of 100 students and eventually 100 Black and/or 100 Hispanic and/or 100 Native American families. Rome was not built in a day. You have to start somewhere. [I offered my time for free to tutor in high school (to four Black male 9th and then 10th graders every month for two years after which I graduated and moved away to college). I weekly tutored three families of Hispanic elementary students (grades 3-5) living on my block while I attended the University of California in Southern California and two of the children of my neighbors in my all-Black neighborhood in Washington D.C. when I was a young lawyer. You will be surprised how much progress you can see your students making, even as an untrained teacher. You can make a difference!]
Specific Suggestion #1A (a subset of Suggestion #1): ILG Members should make it a formal part of their Affirmative Action Plans to create a centralized “Tutoring Pool” of companies, including like-minded non-ILG Member companies. Use the “Tutoring Pool” to gather corporate donations to fuel a multi-year fund to pay for professionally trained tutors to work with Black, Hispanic and Native American students. You decide the level (Elementary Schools? Middle Schools? High Schools? Or maybe take students all the way through High School from 9th grade until they graduate).
Specific Suggestion #2: ILG Members should follow the lead of David Packard, the co-founder of Hewlett-Packard, also a leader in public education. In the early 1980s, Mr. Packard put together a coalition of over 700 technology companies in Silicon Valley to interdict the public schools (which he thought were failing the Tech community in STEM classes) by relieving employees from corporate duty (who remained on the corporate payroll) to go into the local public schools and teach math and science for a semester (like a sabbatical program). They also used the opportunity to teach the high school teachers how to teach math and science. (The outcome of the teach-the-teachers idea was eventually the creation of the Noyce Foundation to provide Fellowship Scholarships to teach STEM in the public schools throughout the nation. Big trees can grow from small seeds).
So, get corporate sponsorship to go into the public schools, physically, and supplement their educational programs. If you want change, you have to do something different than last year.
By the way, Mr. Packard’s view, which is now fairly-well accepted doctrine in Silicon Valley education, is that students must start taking the right mix of classes as early as the 6th or 7th grade to be properly prepared to enter college heading towards a technology job.
Specific Suggesiton #3: ILG Members should form a project, as part of their company’s Affirmative Action Program, to determine if their public schools are undertaking social promotion of Black and Hispanic students. If you find out it is happening in your local schools, lobby the schools to return to merit principals. ILG Members should partner with their companies, their recruiters, the various chambers of commerce in their locale, and with business trade associations to effect the needed change. If you don’t break some eggs, you cannot make an omelet.
And remember creating availability is the highest form of non-preferential “Affirmative Action.” (That notion of increasing availability of under-represented groups used to be in OFCCP’s Rules before the 2000 reforms of 41 CFR Section 60-2). You don’t need OFCCP to tell you to do this. You have the license to define your Affirmative Action efforts more broadly than OFCCP’s Rules require and do what you think would be effective to position your company’s recruiting needs to be better served in the foreseeable future.
And make this project part of your company’s Affirmative Action Outreach Programs to return merit education to the classroom so your company can harvest the results years later when hiring needed new employees. Quit complaining about the scarcity of highly qualified candidates: start building them.
There do not seem to be statistics to size how big the public-school social promotion problem is. What employers do know is that it haunts their later recruitment opportunities.
Note: Reported in the August 5, 2020, Public School Review: “According to the American Federation of Teachers, a majority of teachers said they promoted students up that were not prepared for the next grade level.“
Reliable nationwide longitudinal statistics on the use of social promotion practices in our public schools are not available so much as I can determine. However, here are three anecdotes from my personal files:
Anecdote #1: I represented a large manufacturing company located in the mid-West. In 1990’s dollars, it was spending $3 Million per year ($7M in today’s dollars) to teach its employees to read. These were not immigrant hires. Almost all of the thousands of employees they were teaching to read each year (as reading became a must on the production lines as more and more training and messaging was occurring via the written and digital word) had attended public schools in the mid-west. 100% of the employees learning to read were 18 or older. Over 90% of the employees learning to read were African Americans from inner-city schools which had practiced social promotion from elementary school onward.
Anecdote #2: I defended a lawsuit OFCCP had threatened to file against a large automobile manufacturer in a large manufacturing city in Ohio (to remain nameless). To compete with innovative Japanese manufacturers, my client had introduced simple paper and pencil adding, subtraction, and multiplication tests that mirrored the kind of simple math they needed to perform on the production lines to order parts to their workstations “just in time.” (Japanese manufacturers had developed the “just-in-time” work systems then unknown to American manufacturers, although they are now the norm today). But this was new for American manufacturers and their employees and required 9th-grade math skills and 7th-grade reading skills.
My client required this knowledge to allow a production worker to timely order a sufficient number of the parts s/he was installing on the cars passing his/her workstation on variable speed production lines to be delivered via overhead baskets “just in time.” The employee also needed to read short written instructions from time to time to adjust to new parts being installed, or to work on different models of vehicles, or to fill in for another team member somewhere else down the line installing different parts. The newly installed math and reading tests, unfortunately, had a statistical “adverse impact” on African American employees for these highly coveted $80,000 per year assembly line jobs.
My Expert Witness studied the public elementary, middle school, and high school system from which all but a few of the at-issue African American production workers had attended and from which all but one or two had graduated. My Expert’s report was startling. It reported that the average African American graduating from high school in that city had only a 4th-5th Grade mastery of Mathematics and a 5th Grade reading level.
My Expert Witness also interviewed a number of the school principals in the school system and found that they all had practiced an approved “social promotion” policy to advance students to the next grade whether the student was proficient in his/her existing class work before moving to the next higher-class level. Several of the principals remarked that their greater concern was not the knowledge proficiency of the students but was to ensure their students were in class and not truant.
Context: When I lived in Washington D.C., I resided in an all-Black inner-city neighborhood for seven years before relocating to the West Coast. I believe that we should all live our values and help integrate DC’s highly segregated neighborhoods. The local High School (Cardoza High, formerly “Central High” because it was dead-center in the middle of the 64-mile square known as the District of Columbia) was three blocks from my house. I soon noticed that many students were not in school during their school days but rather were outside on the streets and in public parks. Eventually, I screwed up the courage to walk into the High School which I passed every day on my walk to work and asked to speak to the principal. The principal was unavailable so I asked an assistant whether these kids should be in school. That aide dug out of a drawer a “Truancy Policy” which stated that students would not be counted as truant until their 30th unexcused missed day of classes. So, 29 missed school days was routinely tolerated without question in about a 180-day annual school year (about 16% of that student’s educational year).
Contrast: Years later, I moved to northern California and soon began to tutor a neighbor’s child faltering badly in her schoolwork, and in life generally, as she was graduating from the 8th grade into her first year of high school. Her mother, a single mom, was very concerned about her daughter and knew she could not help her with high school-level math or English. The mom enrolled her daughter in the local public high school and provided my name and phone number as a contact for educational training issues. On the child’s first day of high school, I received an after-hours telephone call to my home phone (back in the days of landlines) from an assistant principal at the high school to report that Erin had been 10 minutes late to 4th period and had missed fifth period entirely. WOW! Same-day after-hours informal truancy notification in northern California vs. no truancy concern for 29 missed days in downtown D.C.? Yes, the educational systems are different. W-A-A-Y different. That scenario is not uncommon throughout the United States, where suburban schools and inter-city schools have completely different rules and regulations. This is just one area that desperately needs attention and the business community can help.
You must find out what kind of a school system your future employees are coming from and get those schools to stop just letting students “slide.” Your managers will not cut employees that kind of slack or “socially promote” them to the next higher job level without warranting the promotion, even if they do get hired through some miracle. What lessons are these children learning as future employees about punctuality, reliability and excellence?
An interesting 2012 Monograph in the files of the U.S. Department of Education is titled Social Promotion or Grade Repetition: What’s Best for The 21st Century Student. The Monograph reports the history (much earlier than I thought) of the social promotion school of thought and details the pros/cons of the “merit promotion” vs “social promotion” philosophies of education.
Specific Suggestion #4: ILG Member companies should band together to lobby the public schools to return vocational training in construction craft trades to the high schools. It is ridiculous that companies continue for the third decade in a row to beg for skilled carpenters, painters, electricians, plumbers, welders, maintenance mechanics, etc. (I have one client who last year turned down in one year over one billion dollars of construction contracts to build bridges and roads because it remained 400+ welders and several hundred skilled steel workers short of what it would take to commit to these large-scale projects…and after Herculean recruitment and training efforts).
Meanwhile, every Republican and Democrat Administration in Washington emphasizes the need to engage in various forms of apprenticeships to build the availability of skilled craft workers the public schools have declined to train. And every political administration coming into the White House for the last two decades has proselytized that the biggest beneficiaries of skilled craft apprenticeship training would be Hispanics (who have now become primarily responsible for building America’s roads, commercial buildings and homes) and African Americans.
Specific Suggestion #5: ILG Members should work with their companies to create private high school and college scholarship funds, both for Incumbent Employees (not based on Protected Group status) and for schools or funds to spend the money on their target Protected Groups.
Because there is no employment transaction involved, non-discrimination laws (like Title VII and Executive Order 11246) will not attach to or interfere with corporate donations directed to particular targeted Protected Groups, like the United Negro College Fund (the nation’s largest private scholarship provider to students of color) or the Hispanic Scholarship Fund (one of the largest scholarship providers to Hispanic students).
Those companies/institutions which are signatory to federal grants (“Federal Financial Assistance”) will need to check with counsel to obtain an opinion whether Title VI (not Title VII) of the 1964 Civil Rights Act would prohibit a race/national origin-based charitable donation.
There are many reports that document that African American college and University students carry much more student debt than other racial and national origin groups. There are also many reports that college and university-eligible African Americans choose not to attend because they either cannot afford the educational expenses or the loss of income from a job while studying.
Money to attend college is also a problem for Hispanics according to an October 7, 2022, Pew Research Center Report titled “Hispanic enrollment reaches new high at four-year colleges in the U.S., but affordability remains an obstacle.”
I personally plan this year to increase my charitable financial donations to Black and Hispanic educational funds. The future of our country relies on us to level the playing field to try to dampen the growing mood around the country of “we/them.”
The extreme end of the spectrum of this idea of corporate educational scholarships (for either Incumbent employees or to schools) is to build your own in-house colleges, as IBM and Ross Perot (EDS) and other companies did in the 1960s, and possibly to also finance student tuition. These companies saw that the public schools were failing to train data processing engineers and code writers. So, these companies and others “grew their own” in four-year-long training colleges. (EDS helped its employees pay for their in-house college training by loaning them the cost of tuition, and then waiving one year of the tuition cost for each year of continued service at EDS after graduation. That made technical college cost-free to the employee who would stay on for four years).
2. Is there a pipeline problem already, even before the effects of the return to race/national origin-neutral admissions practices set in?
You bet there is: Latest High School and College/University Graduation rates, By Race & National Origin Follow
First, the numbers so you can agree there is a problem to fix. The numbers are appalling. While Black and Hispanic high school and college graduation numbers have been steadily increasing, it has been a slow climb and even while aided, in part, by “social promotion” in the lower schools (practiced by some public schools) and by race/national origin-based admission preferences to some extent in some colleges and universities. (See above, Part A). Our elementary, middle, and high schools have been failing Black and Hispanic students wholesale for the last century, at least, compared to the progress of Asian and White enrollments.
College and University Graduation Rates: Let’s start with college and university degrees conferred as of 2023 according to a June 28, 2023 (“hot-off-the-presses”) Research.com report:
Asians
- Asian/Pacific Islander students in bachelor’s programs have a five-year graduation rate of 69.3%.
- 6.6% of college graduates are Asian/Pacific Islander.
Whites:
- White students in bachelor’s programs have a five-year graduation rate of 62.2%.
- 2,410,070 or 59.1% of college graduates are White.
Hispanics
- Hispanic or Latino students in bachelor’s programs have a five-year graduation rate of 41.5%.
- 532,720 or 13.1% of college graduates are Hispanic or Latino
Black/African American
- Black or African American students in bachelor’s programs have a five-year graduation rate of 40.5%.
- 452,760 or 11.1% of college graduates are Black or African American.
High School Graduation Rates in the U.S. By Race/National Origin
This report is taken from America’s Health Rankings (for 2023)
- Asian/Pacific Islander…………………..92.6%
- White…………………………………………..89.4%
- Hispanic………………………………………81.7%
- Black……………………………………………79.6%
- American Indian/Alaska Native……74.3%
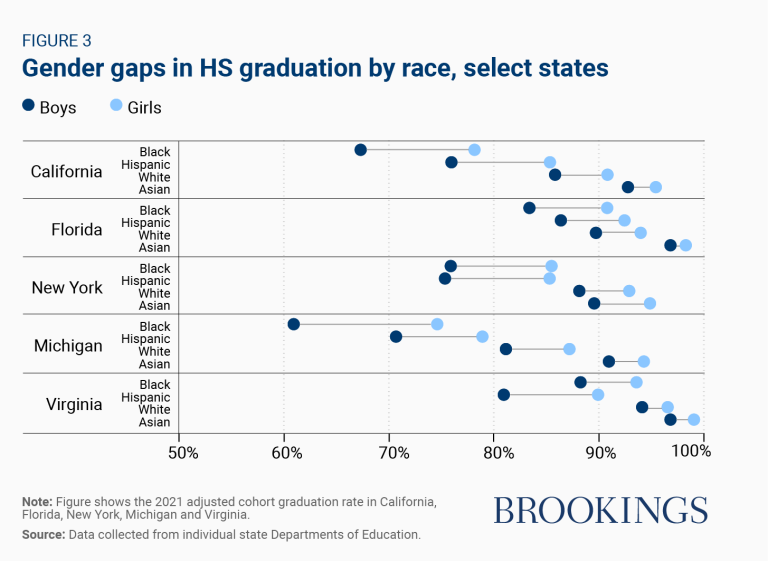
According to an April 18, 2023, Brookings report titled Racial disparities in the high school graduation gender gap, there is a substantial gap between the percentage of Blacks and Hispanics who finish high school compared to Whites, and that gap is even larger when compared to Asians. And that does not adjust for the common practice of “social promotion” to increase the percentage of Black and Hispanic students who may graduate from high school. Here is a chart Brookings prepared reporting the graduation rates by race of five large states which report those data: California, Michigan, New York, Virginia, and Florida:
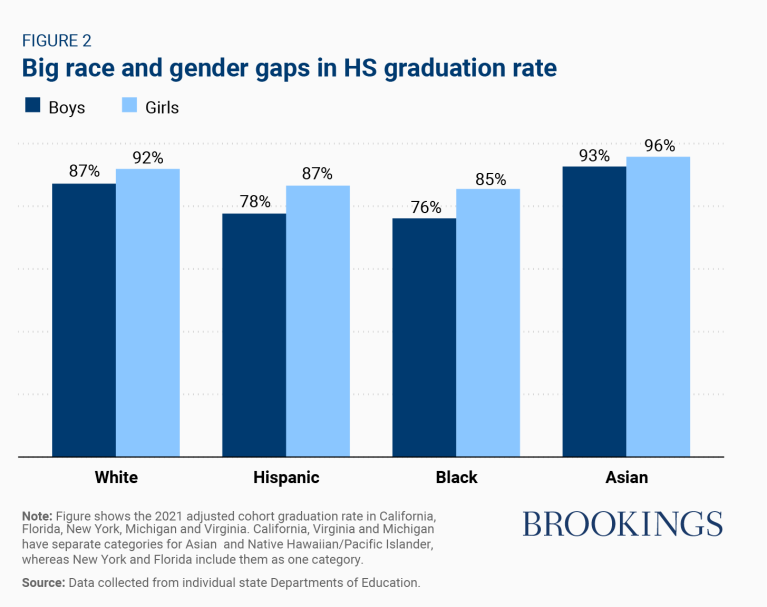
Here is another way to view those same Brookings data (I use data in the plural per the New York Times Style Guide):
Conclusion: There is a lot of work to be done out there to create equality of education to achieve equality in employment. We need to do some new and different things and redouble our efforts because the challenge is greater today than in the past. Change starts with you.
Find a way to be affirmative out there!
THIS COLUMN IS MEANT TO ASSIST IN A GENERAL UNDERSTANDING OF THE CURRENT LAW AND PRACTICE RELATING TO OFCCP. IT IS NOT TO BE REGARDED AS LEGAL ADVICE. COMPANIES OR INDIVIDUALS WITH PARTICULAR QUESTIONS SHOULD SEEK ADVICE OF COUNSEL.
Continue Reading
SUBSCRIBE.
Compliance Alerts
Compliance Tips
Week In Review (WIR)
Subscribe to receive alerts, news and updates on all things related to OFCCP compliance as it applies to federal contractors.
OFCCP Compliance Text Alerts
Get OFCCP compliance alerts on your cell phone. Text the word compliance to 55678 and confirm your subscription. Provider message and data rates may apply.