 The DE OFCCP Week in Review (WIR) is a simple, fast and direct summary of relevant happenings in the OFCCP regulatory environment, authored by experts John C. Fox, Candee J. Chambers and Cynthia L. Hackerott. In today’s edition, they discuss:
- Four Implications Impacting Federal Government Contractors and Employers Following the SCOTUS Decision in the Harvard & UNC Cases + “Life Preserver” Practical Next Step Suggestions
- House Education & Workforce Committee Chair Sought GAO Opinion on How Long Julie Su Can Serve as U.S. DOL Acting Secretary
- JOLTS Report – Job Openings Decreased by 496k in May, Rate Decreased Slightly to 5.9%
- Economy Added a Modest 209k Jobs in June, Short-Term Unemployment Rate Down Slightly to 3.6%
- Looking Ahead: Upcoming Date Reminders
Monday, July 3, 2023: Four Implications Impacting Federal Government Contractors and Employers Following the SCOTUS Decision in the Harvard & UNC Cases + “Life Preserver” Practical Next Step Suggestions

Part A, below, describes the continuing and growing “Pipeline” problem.
Part B, below, throws employers “life-preserver” suggestions to deal with the problem.
Part A: Overcoming the Coming Minority Professionals Pipeline Problem
The SCOTUS Harvard/UNC case decision reported that only about 25% of institutions of higher learning (universities and colleges) in the United States have been undertaking race-based and national origin-based admission decisions. I have previously seen uncertain reports that perhaps 100 colleges and universities have undertaken race/national origin-based admission practices. So, the SCOTUS report could be correct.
However, the volume of the race/national origin-based admissions the universities have reported in the lawsuits which have reached the SCOTUS have been quite large as a percentage and a number (from 2% of the entering class to a more typical 10% (Harvard; University of Michigan Law School), 16% at UC Davis Medical School, and 25%, at UNC).
The litigated database is of course quite small. Apart from the uncertainty about how many colleges and universities have undertaken race/national origin-based admission practices, no one knows whether the litigated case admission preferences practices are representative of all colleges and universities which have used race/national origin-based admission practices.
Regardless how you count, it appears certain that a significant number of African American and Hispanic candidates for colleges and universities will be affected. Indeed, without quantifying their concerns, both Harvard and UNC argued to the SCOTUS, for example, that there was a large need to continue race/national origin-based admission practices. Both schools also argued that the result of returning to “colorblind” admission policies would have a large impact on the diversity of their admissions. As a result, employers will eventually be affected as they look out their recruiting doors in coming years to find that the diversity of their applicant pools for professional, technical, and managerial positions has shrunken noticeably.
UNC’s race-based/national origin-based admission practices led annually to the admissions of about a thousand students at UNC alone according to the SCOTUS Majority Opinion, discussed more fully below (with which five other Justices joined for a total of 6 of the 9 Justices). These are students who would not otherwise have been admitted to UNC but for their race/national origin. One can only speculate how many tens of thousands of Black and Hispanic graduates were admitted to colleges and universities based on their race/national origin who now will not be admitted to those same colleges and universities going forward. When one adds up the affected admission decisions of almost 100 universities and colleges which have reportedly engaged in race/national origin-based admission decisions in the last two decades since the SCOTUS “greenlighted” certain narrowly prescribed race-based admission practices, the annual total is unknown (to anybody) but is obviously going to be a very big number. One hundred times anything but zero is a big number. 100 x 10 students = 1,000. 100 x 100 students = 10,000. 100 x 1,000 = 100,000.
Now that lawful race-based/national origin-based preferences are cut-off as of this Fall’s admission decision-making cycle to admit students for the Fall 2024 entering classes, the graduating classes of 2028 will look QUITE different from a diversity perspective to prospective employers than they have for the last decade-plus.
In Part B, below, we discuss what employers might start doing now to mitigate that coming drop-off of diversity in their professional, technical/managerial applicant flows beginning in 2028. The bottom half of Part B also reports the latest graduation rates, by race and national origin for both college/university graduations and for high schools in the United States. Spoiler Alert: Asians continue to graduate in higher percentages, followed by Whites, and then drop back significantly to Hispanics and then to African Americans and then Native Americans.
Thursday, July 6, 2023: House Education & Workforce Committee Chair Sought GAO Opinion on How Long Julie Su Can Serve as U.S. DOL Acting Secretary
Meanwhile, Ms. Su Suddenly Increased Press Visibility

A Tale of Two Statutes
Generally, federal job vacancies are governed by the Federal Vacancies Reform Act of 1998 (“Vacancies Act”). That statute (5 U.S.C. §3346) established requirements for temporarily filling vacant positions in Executive Branch agencies that require presidential nomination and Senate confirmation. Among other things, it identifies who may temporarily serve and for how long. The GAO issues letters to the President and Congress reporting violations of the Vacancies Act’s time limitations and issues decisions on agency compliance when requested by Congress.
In Item #7 of its FAQ on the Vacancies Act, the GAO explains:
“If there is a first or second nomination for the position, an acting officer (who is not the nominee or is the nominee and meets certain exceptions) may serve while the nomination is pending in the Senate. (5 U.S.C. § 3346(a)(2).) If the nomination is rejected or returned by the Senate or withdrawn by the President, an acting officer may serve for no longer than 210 days after the date of the rejection, return, or withdrawal. (5 U.S.C. § 3346(b).) These additional periods of acting service only apply to the first and second nominations. Further acting service is not permitted after 210 days following the rejection, return, or withdrawal of a second nomination, even if a third nomination is made. (5 U.S.C. § 3346.)”
However, the statute (29 U.S.C. §552) that created the position of Deputy Secretary of Labor provides:
“The Deputy Secretary shall (1) in case of the death, resignation, or removal from office of the Secretary, perform the duties of the Secretary until a successor is appointed, and (2) in case of the absence or sickness of the Secretary, perform the duties of the Secretary until such absence or sickness shall terminate.”
Chair Foxx Wants to Know Which Statute Prevails
In a letter to U.S. Comptroller General Gene L. Dodaro, EW Committee Chair Foxx inquired as to whether the statute that created the position of Deputy Secretary of Labor “qualifies as a statutory provision that operates as an exception to the Vacancies Act’s exclusive authority, as described in 5 U.S.C. § 3347(a)(1)?” Foxx also wanted to know whether there are any legal “time limitations on Ms. Su’s acting service, and if so, what are those limitations?”
Meanwhile, Acting Secretary Su Came Out of Her Self-Imposed “Hiding” By Kicking Off Energetic Public Appearances In A Last Ditch Effort To Win Confirmation
In an apparent Biden Administration strategy switch, Acting Secretary Su appeared all over the national press on Friday, July 7 (including CNN, Bloomberg, MSNBC, Fox Business, and Yahoo Finance, among others) discussing the June Bureau of Labor Statistics Jobs Report and her confirmation prospects (saying she is still hopeful for confirmation.) Since she was nominated for the top U.S. Department of Labor (“DOL”) spot in mid-March, Ms. Su has not made any formal public statements aside from Senate and House hearings. Her general silence broke on Friday, June 30, when the DOL posted her blog touting “Bidenomics.”
Moreover, Ms. Su had not issued a press statement or otherwise commented on the monthly BLS Job Report for three months in a row following her Secretary of Labor nomination. Rather, after Marty Walsh’s departure, Assistant Secretary of Labor for Public Affairs Julie McClain Downey issued the DOL’s routine press statement on the Jobs Reports for March, April, and May. However, on Friday, July 7, Acting Secretary Su issued the official DOL statement on the June Jobs Report.
Thursday, July 6, 2023: JOLTS Report – Job Openings Decreased by 496k in May, Rate Decreased Slightly to 5.9%

Note: The BLS computes the “job openings rate” by dividing the number of job openings by the sum of employment and all job openings in the month in question (i.e., all filled and unfiled jobs) and then multiplying that quotient by 100. The jobs opening rate thus provides a quick index of whether the number of new jobs is growing relative to the size of the workforce.
A smaller job openings rate is reporting that the percentage of new jobs is shrinking compared to the size of the workforce. Economists refer to that condition as a “tightening” of the workforce. Consequences of a tightening labor market are that workers have a more difficult time finding a job or the job they want, and recruiters find it easier to place candidates who have fewer alternative options.
In May, the largest decreases in job openings were in health care and social assistance (-285,000), finance and insurance (-139,000), and other services (-78,000). Job openings increased in educational services (+45,000), state and local government education (+37,000), and federal government (+24,000).
Hires, Total Separations, & Quits Up Slightly, Layoffs/Discharges & Other Separations Down a Bit
The number of hires in May was 6,208,000 (4.0 percent rate) compared to the adjusted 6,101,000 number (3.9 percent) for April. May hires increased in durable goods manufacturing (+41,000).
Total separations were up a little at 5,871,000 (3.8 percent rate) for May, compared to 5,660,000 (3.6 percent rate) for April. Within separations, quits in May were 4,015,000 (2.6 percent rate) up from 3,765,000 (2.4 percent rate) in April. May quits increased in health care and social assistance (+69,000) and in construction (+57,000).
Layoffs and discharges in May were 1,555,000, down a smidge from 1,590,000 in April. The percentage rate remained steady at 1.0. The number of other separations was 301,000 in May, down from 305,000 in April. The percentage rate remained steady at 0.2. In May, layoffs and discharges increased in retail trade (+87,000).
BLS posted interactive graphs here.
Three-Month Comparison Chart of Job Openings vs Jobs Filled
Our below table reports the number of available jobs (as taken from the revised JOLTS reports) from the last four months of available data, as revised and reflects a gentle roller coaster ride, first very slightly down and then slightly up and then slightly down again.
| Reports | February | March | April | May |
|
JOLTS available jobs Prior/mo. comparison |
9,974,000 (589,000 < January*) |
9,745,000 (229,000 < February) |
10,320,000 (575,000 > March) |
9,824,000 (496,000 < April) |
*January Job Openings were 10,563,000
Note: BLS scheduled the release of the June 2023 JOLTS Report for Tuesday, August 1, 2023.
Friday, July 7, 2023: Economy Added a Modest 209k Jobs in June, Short-Term Unemployment Rate Down Slightly to 3.6%
“Prime Age” Women Workers Rate Highest on Record
Federal Reserve Anti-Inflation Tactics Slowing Jobs Growth at The Expense of Workers
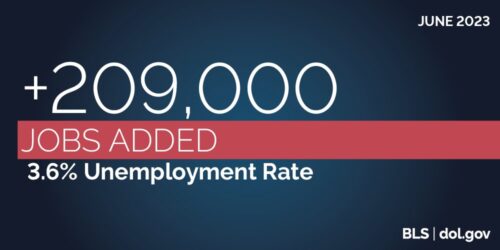
The number of unemployed persons was 5,957,000 million in June, down by 140,000 from the 6,097,000 figure in May. In June, the number of long-term unemployed (those jobless for 27 weeks or more) was 1,105,000 (18.5 percent of the total unemployed), which was down a bit from May’s adjusted figure of 1,188,000 (19.8 percent of the total unemployed).
Job Gains Trends
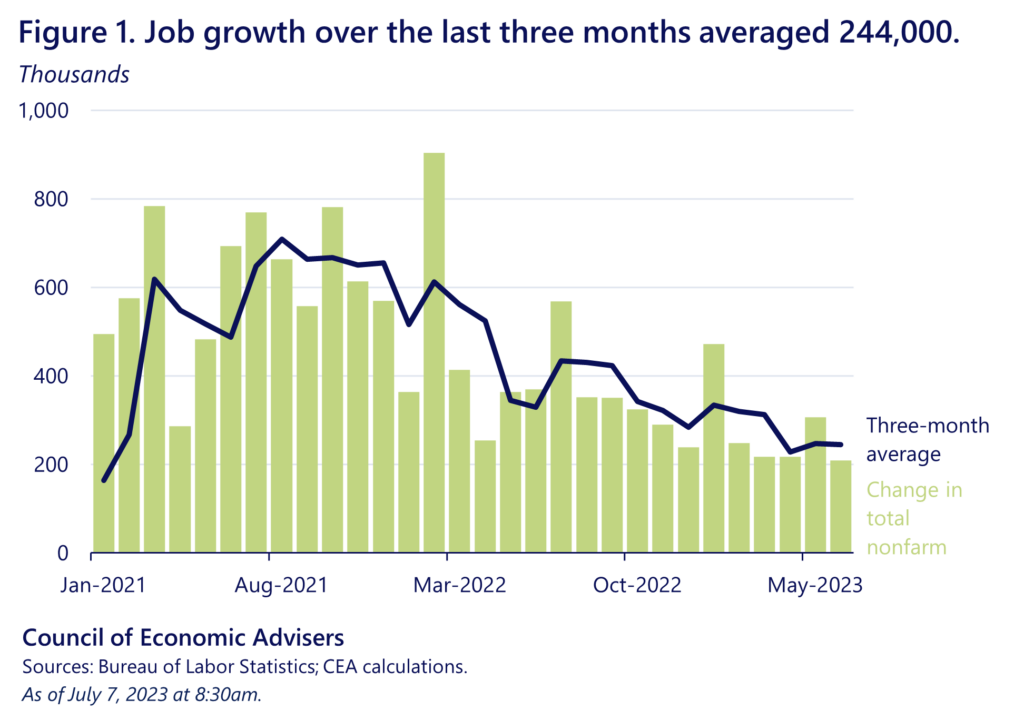
The job gains number for June was down by 97,000 from the adjusted May figure of 306,000. Employment growth in April was revised down by 77,000 jobs and in May by 33,000 jobs. (See Jobs Growth Down Curve Chart, below.)
In June, employment continued to trend up in government, health care, social assistance, and construction. The economy has added an average of 244,000 jobs over the past three months and 316,000 over the past year, the White House Counsel of Economic Advisers (“CEA”) noted in its blog statement on the June Jobs Report, as illustrated by the following chart:
“Prime Age” Women Workers Rate Highest on Record As More Women Are Working
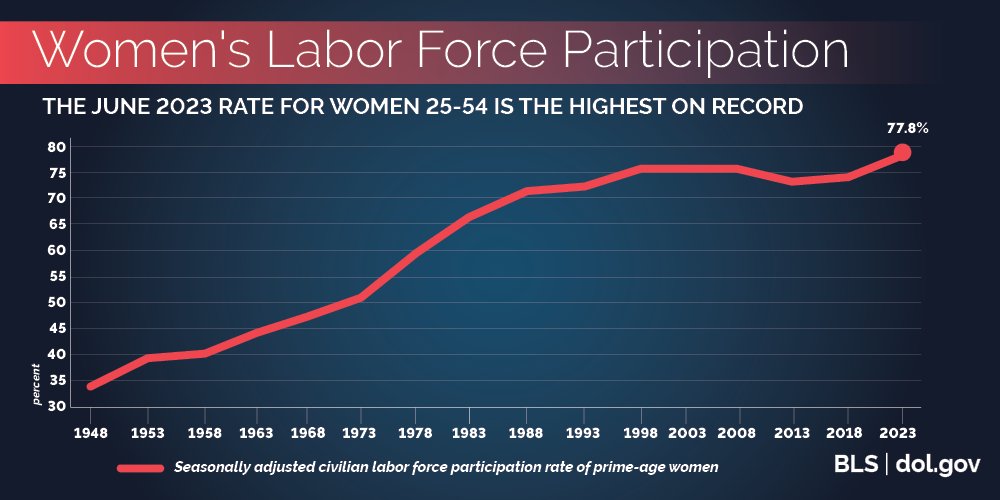
In June, the labor force participation rate for women ages 25-54 (known as “prime-age workers”) increased to 77.8% — the highest on record since the BLS began tracking this metric in 1948, the U.S. Department of Labor noted in a tweet.
Major Worker Groups
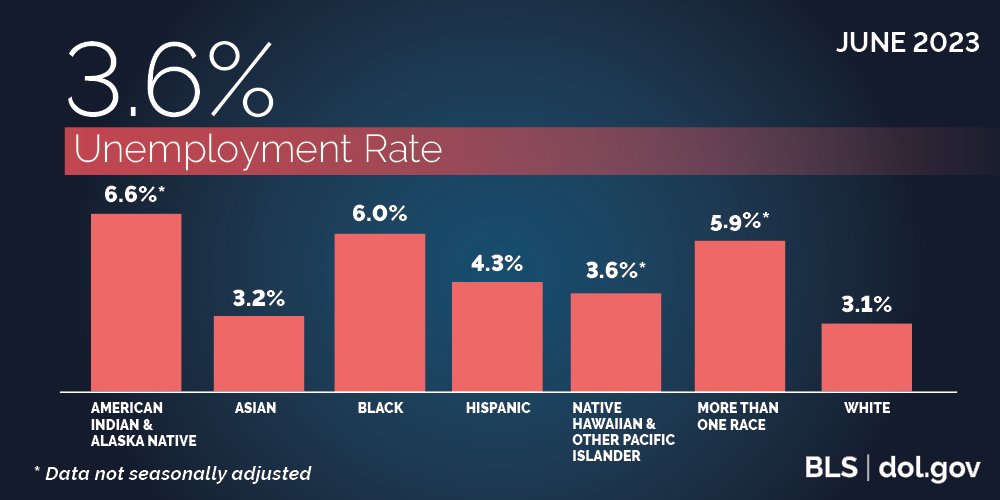
The BLS/DOL charts below illustrate the numbers by race and national origin (not seasonally adjusted) showing that there are a large percentage of Black and Native Americans unemployed and available to be employed relative to Whites and Asians:
Our table below compares the unemployment percentages of the major worker groups from the last 3-months of available data and benchmarking against the COVID-19 Pre-Pandemic percentage. Note: Despite Acting Secretary Su’s optimistic remarks, Black unemployment is not only soaring (increased 1.2% in the last two months), but it is the only metric other than Two or More Races which is not stable and is noticeably deteriorating):
|
The Employment Situation – June 2023 |
||||
| Unemployment Rate | April 2023 | May 2023 | June 2023 | Feb 2020 Pre-Pandemic |
| National (Seasonally adjusted) |
3.4% | 3.7% | 3.6% | 3.5% |
| White | 3.1% | 3.3% | 3.1% | 3.0% |
| Black | 4.7% | 5.6% | 5.9% | 6.0% |
| Asian | 2.8% | 2.9% | 3.2% | 2.5% |
| Hispanic (Seasonally adjusted) |
4.4% | 4.0% | 4.3% | 4.4% |
| Native Hawaiians & Other Pacific Islanders | 3.4% | 4.5% | 3.6% | 2.7% |
| Two or More Races (Not seasonally adjusted) |
4.4% | 4.7% | 5.9% | 6.1% |
| Men (20+) | 3.3% | 3.5% | 3.4% | 3.2% |
| Women (20+) (Seasonally adjusted) |
3.1% | 3.3% | 3.1% | 3.1% |
| Veteran (Not seasonally adjusted) |
2.1% | 2.5% | 2.7% | 3.7% |
| Individuals with Disabilities (Not seasonally adjusted) |
6.3% | 7.8% | 6.8% | 7.8% |
BLS has additional, interactive graphs available here.
See Also:
- President Biden’s remarks
- Acting Secretary of Labor Julie Su’s remarks
- USDOL video short illustrating the report
- White House Counsel of Economic Advisers’ blog
Looking Ahead:
Upcoming Date Reminders
June 2023: OFCCP’s current target date (now overdue) for its Final Rule on Pre-Enforcement Notice & Conciliation Procedures (RIN: 1250-AA14)
June 2023: U.S. DOL WHD’s current target date (now overdue) to publish its Final Rule on Nondisplacement of Qualified Workers Under Service Contracts (RIN: 1235-AA42)
June 2023: U.S. DOL WHD’s current target date (now overdue) for its Final Rule on Updating the Davis-Bacon and Related Acts Regulations (RIN: 1235-AA40)
June 2023: U.S. OSHA’s current target date (now overdue) to publish its Final Rule on Occupational Exposure to COVID-19 in Healthcare Settings (RIN: 1218-AD36)
August 2023: U.S. DOL WHD’s current target date for its Final Rule on Employee or Independent Contractor Classification Under the Fair Labor Standards Act (RIN: 1235-AA43)
August 2023: U.S. DOL WHD’s current target date for its Notice of Proposed Rulemaking on Defining and Delimiting the Exemptions for Executive, Administrative, Professional, Outside Sales and Computer Employees (RIN: 1235-AA39)
August 2023: U.S. NLRB’s target date for its Direct Final Rule on Quickie Election Procedures (RIN: 3142-AA18)
August 2023: U.S. NLRB’s current target date for its Final Rule on Standard for Determining Joint-Employer Status (under the NLRA) (RIN: 3142-AA21)
August 2023: U.S. NLRB’s current target date for its Final Election Protection Rule (RIN: 3142-AA22)
August 2023: U.S. DOL’s OASAM’s current target date to publish Proposed Rule on “Revision of the Regulations Implementing Section 188 of the Workforce Innovation and Opportunity Act (WIOA) to Clarify Nondiscrimination and Equal Opportunity Requirements and Obligations Related to Sex” (RIN: 1291-AA44)
Friday, August 11, 2023: Comments due on the EEOC’s proposal to extend – without change – the Information Collection Requirement (“ICR”) for the ADEA/OWBPA third-party waiver and disclosure requirements
Friday, August 11, 2023: Deadline for Presenter Proposal Submissions for DEAMCon 2024
December 2023: OFCCP’s current target date for its Notice of Proposed Rulemaking to “Modernize” Supply & Service Contractor Regulations (RIN: 1250-AA13)
December 2023: OFCCP’s current target date for its Final Rule on “Technical Amendments” to Update Jurisdictional Thresholds & Remove Gender Assumptive Pronouns (RIN: 1250-AA16)
December 29, 2023: Statutory deadline for EEOC regulations to enforce the Pregnant Workers Fairness Act
Wednesday, April 3 – Friday, April 5, 2024: DEAMcon24 New Orleans
June 2024: OFCCP’s current target date for its Notice of Proposed Rulemaking to Require Reporting of Subcontractors (RIN: 1250-AA15)
SUBSCRIBE.
Compliance Alerts
Compliance Tips
Week In Review (WIR)
Subscribe to receive alerts, news and updates on all things related to OFCCP compliance as it applies to federal contractors.


