“What’s does the data say?” “Have you pulled the report?” “Let’s look at the numbers.” These are all common phrases you hear each day. Analytics provides you, and most likely your boss, with the data and metrics necessary to track development, support purchasing decisions, and provide detailed information into various initiatives from recruitment to outreach, and more. With human resources touching an abundance of business processes, you likely have access to a mountain of data in varying systems, but the reporting function is what sorts through that endless data to compile a neat, organized file that solidifies your point of view or shows results of your efforts. At the end of the day, having customized reports gives you the flexibility to segment your data based on your unique business goals and needs.
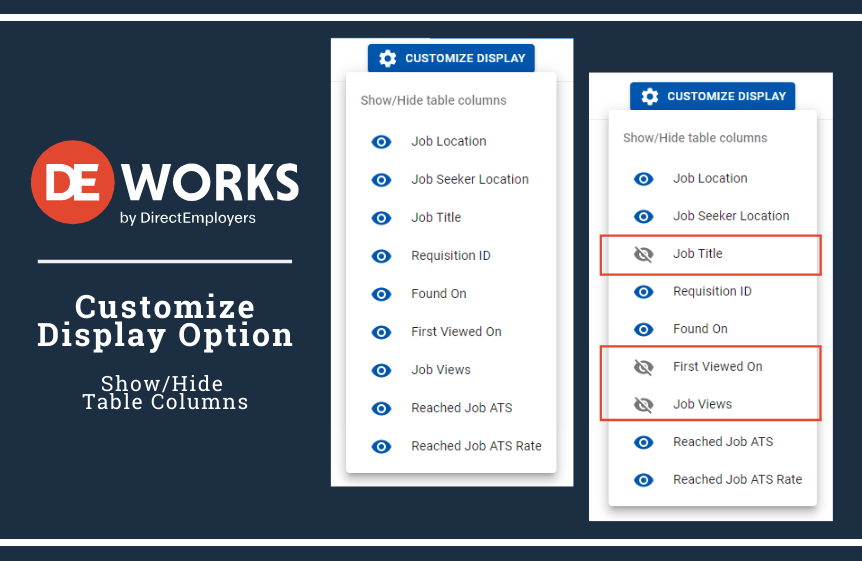
In our most recent DEvelopments post, we boasted about the new functionality of our Analytics interface. One significant change we honed in on was the ability to show and/or hide columns to create custom reports. Let’s dive in on how this simple feature can impact your reporting needs to display only the data points that are relevant to your needs.
Log in to Analytics by navigating to DE.works and selecting ‘Analytics’ in the drop-down menu. From that point, you’ll see the main reporting interface. Remember the mountain of data? Now you can easily narrow down what data points are displayed by easily clicking on the show/hide functionality to the right of each filter.
Alternatively, you can easily run a full report, view the results, and then click the ‘Customize Display’ button to show/hide columns displayed in your report. Easy peasy!
With these tips and tricks in mind, you can easily manipulate the reporting functionality to customize the columns displayed in your reports. The best part of this feature is that you can quickly go back in and tweak reports you’ve saved to display additional data as needed. Now get in there and start reporting! Your co-workers and your boss will thank you later.


Looks great!